Digital currencyEconomicalارز دیجیتالاقتصادی

Bitcoin price analysis + 4 digital currencies that you should keep an eye on this week

Bitcoin experienced a rapid fall to $41,500 after approval of cash ETFs in the US. Despite this drop, the upward movements of some altcoins can be considered a sign of a change in the short-term trend of the market.

Currently, some analysts have changed their view and have a $25,000 or lower target for the price. Although anything is possible in the market, the $38,000 level is expected to attract and encourage long-term investors to buy Bitcoin, who are still hoping for an upcoming halving and new funds entering the market through newly launched ETFs.

Digital currency market heat map.

Bitcoin cash ETFs saw a total of $1.4 billion in inflows in their first two trading days, according to Bloomberg analyst Eric Balchunas. In the meantime, Grayscale Institute’s Bitcoin Fund has witnessed an outflow of $579 million, but the net inflow of cash ETFs in these two days is a total of $819 million and positive.

But can the positive news of inflows into Bitcoin cash exchange funds reverse the current trend of BTC and altcoins? In the following, we will examine the chart of Bitcoin and 4 digital currencies that can perform better than the rest of the digital currencies in the short term.

Bitcoin (BTC) price analysis

Bitcoin has gone through volatile days. The unsuccessful attempt of the price to cross 48,000 dollars caused a part of the market to save profits, and then the price experienced a rapid fall on January 12 (December 22).
Bitcoin price analysis + 5 digital currencies that you should keep an eye on this week
One day Bitcoin price chart.

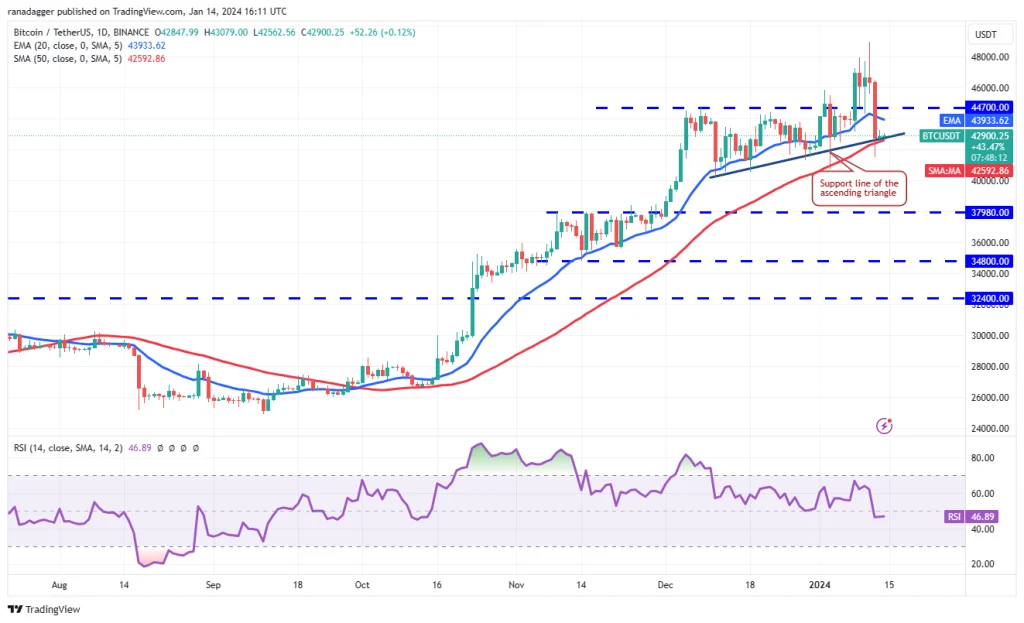
Buyers and sellers are competing hard near the support of the ascending triangle pattern on the one-day chart. So far, buyers have managed to close recent candles above this level, but have failed to initiate a meaningful recovery. This means that sellers have maintained their pressure.

The 20-day exponential moving average (EMA 20 – blue line in the picture), which is now at the level of $43,933, has taken a downward slope, and the relative strength index (RSI) is also below the middle axis (level 50), which means Sellers are trying to get back into the market.

If the price continues to fall below the triangle pattern, the way will open for Bitcoin to fall to $40,000 and then $37,980. Buyers should also push the price above $44,700 to regain market control have taken

Also read: Getting to know 10 technical analysis chart patterns that every trader should know
Bitcoin price analysis + 5 digital currencies that you should keep an eye on this week
4 hour chart of Bitcoin price.

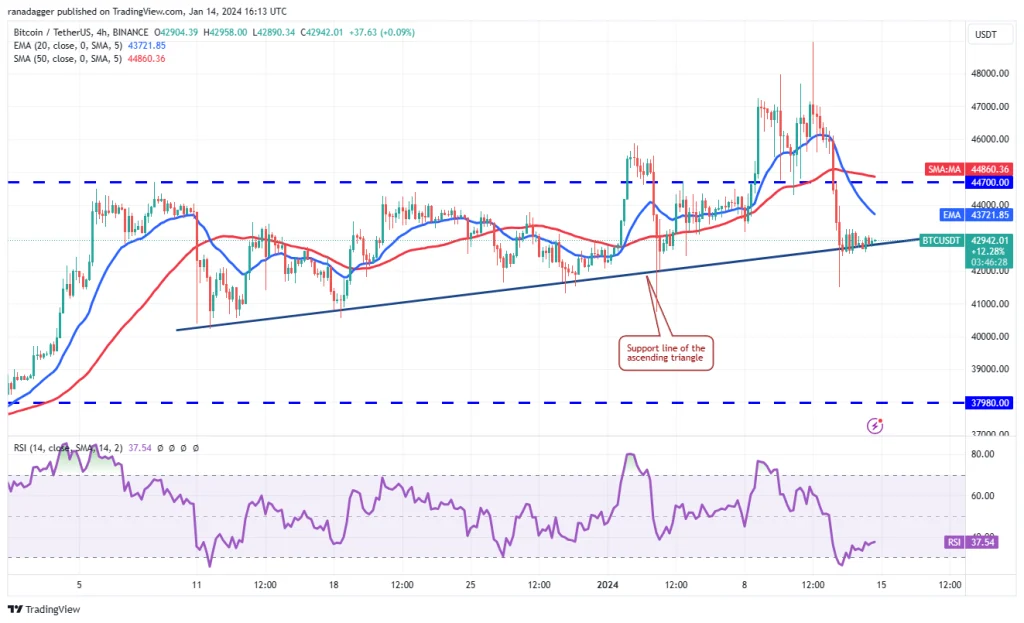
In the 4-hour view of the Bitcoin market, the moving average of 20 candlesticks has a downward slope, and the relative strength index is in the negative area (under the middle axis), which shows the superiority of sellers. If the $42,000 support is broken further, the selling pressure will intensify and the possibility of Bitcoin falling to $41,500 and then $40,000 will increase.

In order to prevent this drop, buyers should raise the price above the 20-candleli moving average. This will pave the way for Bitcoin to reach $44,700; A level that is considered an important resistance for Bitcoin.

Internet Computer Price Analysis (ICP)

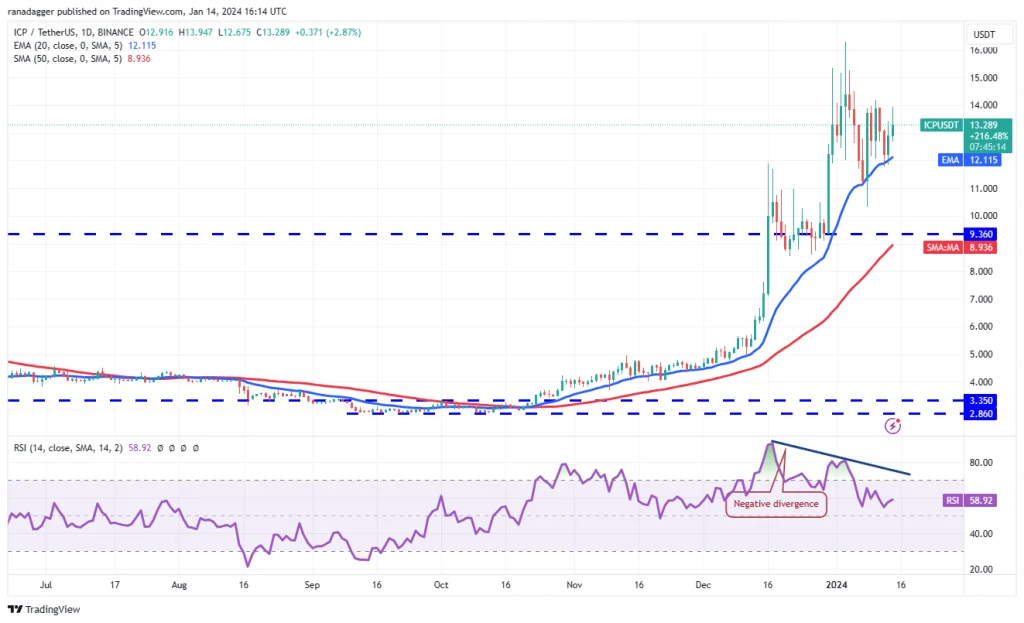
The price of computer internet on January 8th (18th December) returned above the 20-day moving average, and this happened again on January 13th (23rd December), which means that buyers strongly support this level.
Bitcoin price analysis + 5 digital currencies that you should keep an eye on this week
One day chart of computer internet price.

The upward slope of the moving averages shows the superiority of buyers, but the negative divergence between the relative strength index and the price is a warning for the possibility of a decrease in the downward momentum of the price. Crossing and closing the price candle above $14.21 could open the way to reach the peak of $16.30. The success of buyers in crossing this level will increase the probability of ICP reaching $18.

The 20-day EMA ($12.11) remains an important support to watch if the market turns bearish. A break of this support would turn the tables in favor of the sellers and increase the risk of the price falling to $9.36.
Bitcoin price analysis + 5 digital currencies that you should keep an eye on this week
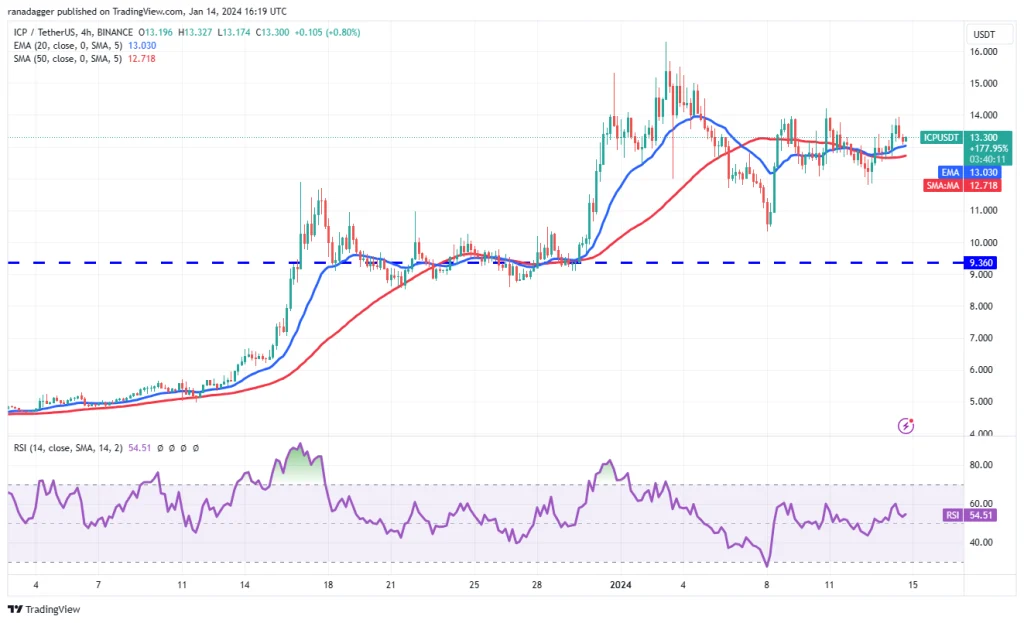
4-hour chart of computer internet prices.

As can be seen from the 4-hour ICP chart, the price has been fluctuating between $12 and $14 for some time, and this shows the indecisiveness of buyers and sellers. If the buyers can continue to push the price above 14 dollars, the chances of the price to jump up to 16.30 dollars will increase.

On the other hand, if the price falls below the moving averages, it means that part of the market will sell after the price peak. After that, the price will likely retest the $12 support. In addition, falling below this level can lead to the fall of computer internet up to 10 dollars.

Celestia Price Analysis (TIA)

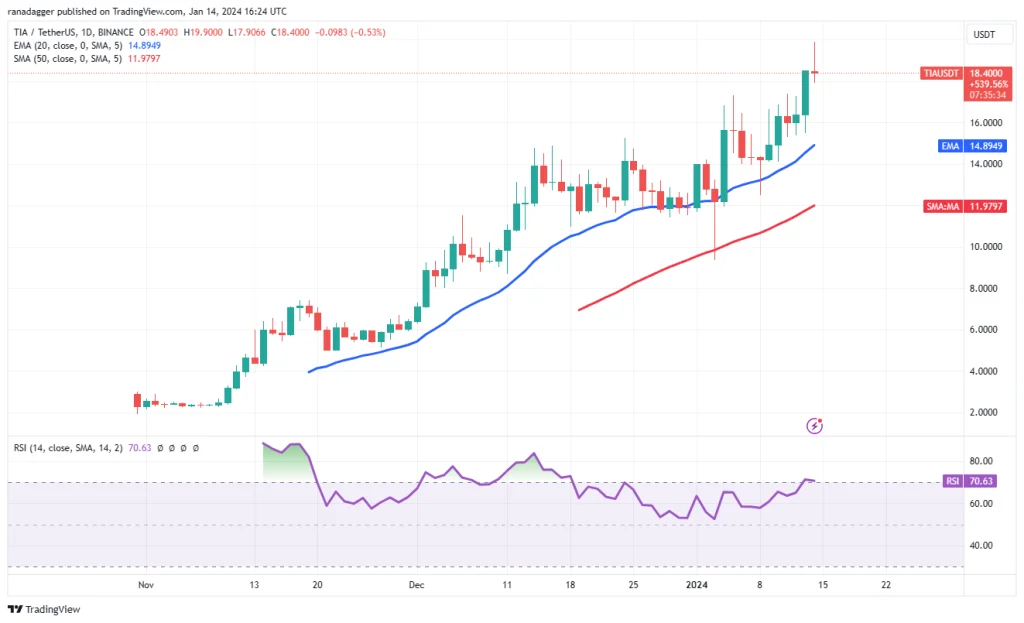
Celestia has been experiencing a strong uptrend for several days, and this situation is a sign that traders are buying at intermittent lows with every drop in price.
Bitcoin price analysis + 5 digital currencies that you should keep an eye on this week
Celestia one day price chart.

There is a not so serious psychological resistance at the $20 level; The level at which TIA previously experienced a pullback. If the buyers do not continue, the price falls below $17.29, which means that this level has become a support. This bullish outlook will be reinforced by crossing $20, and after that $25 could be Celestia’s bullish target.

On the other hand, if the price experiences a quick correction below $17.29, it means that buyers are aggressively storing profits. Next, sellers will have a chance to push the price to the 20-day EMA at $14.89.
Bitcoin price analysis + 5 digital currencies that you should keep an eye on this week
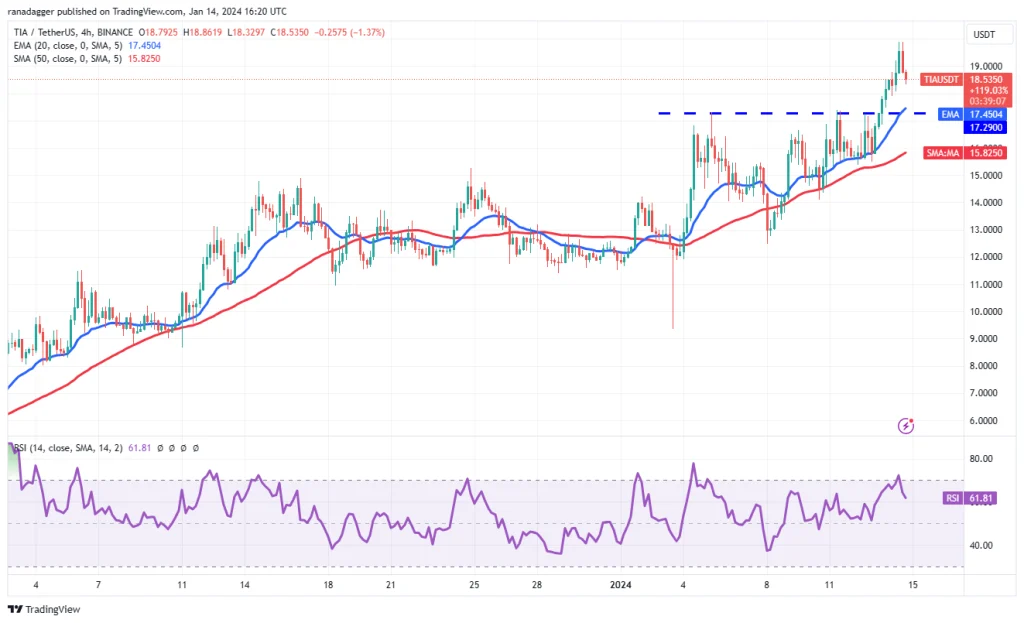
4-hour Celestia price chart.

As can be seen from the 4-hour chart of Celestia, the upward momentum of the price has increased after passing the $17.29 resistance. Therefore, this level is of particular importance in case of a market decline. If a pullback is recorded on the chart, first the 20 candlestick exponential moving average appears as support.

In such a situation, if the price returns above the level of the EMA of 20 candlesticks, it means that traders’ sentiments are still positive and they start buying at the price floors. In this case, Celestia can start the next uptrend up to $23. If the price falls below $17.29, the sellers will temporarily control the market. In this situation, the candlestick 50 simple moving average (SMA 50 – red line in the picture) will be the next support of the TIA.

Mentel Price Analysis (MNT)

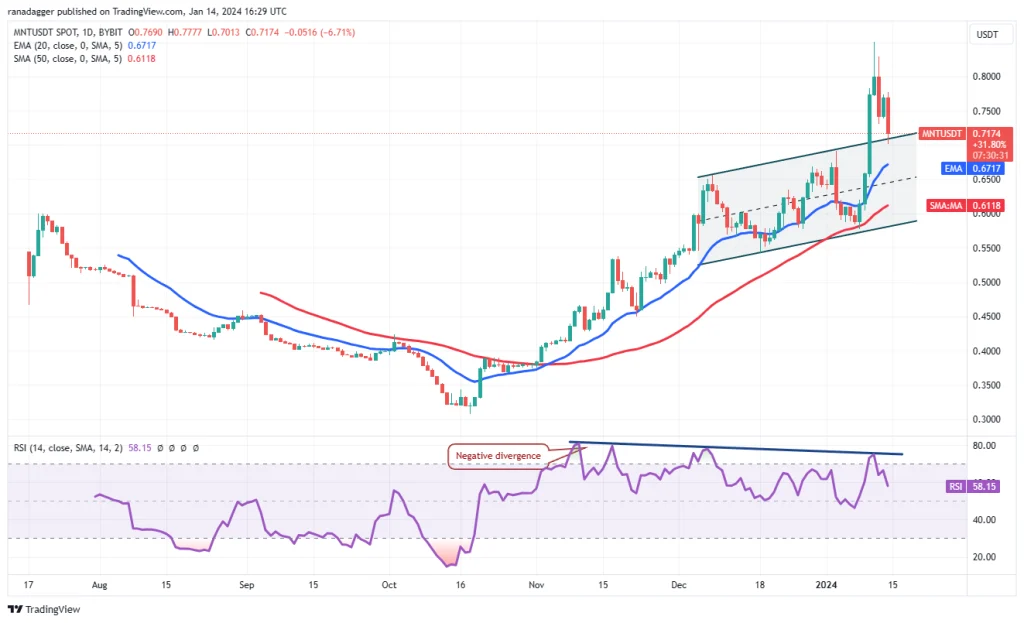
Mantel has just experienced a break above the ascending channel on the one-day chart and has since reached $0.85. However, the long shadow of the candlestick on January 11th (21st) shows that part of the traders started saving profits at the price peaks.
Bitcoin price analysis + 5 digital currencies that you should keep an eye on this week
One day Mantel price chart.

The price is now hovering at a short distance from the breakout of the ascending channel, and buyers are expected to become more active at this level. Both moving averages have taken an upward slope, which is a sign of the superiority of buyers, but a negative divergence between the relative strength index and the price is considered a warning.

If the price continues to recover from the breakout of the ascending channel on the chart, buyers will once again have the opportunity to push MNT to $0.85. This level is expected to act as a serious barrier, but if the price breaks through it, the way for Mantel to reach $1 will be open.
Bitcoin price analysis + 5 digital currencies that you should keep an eye on this week
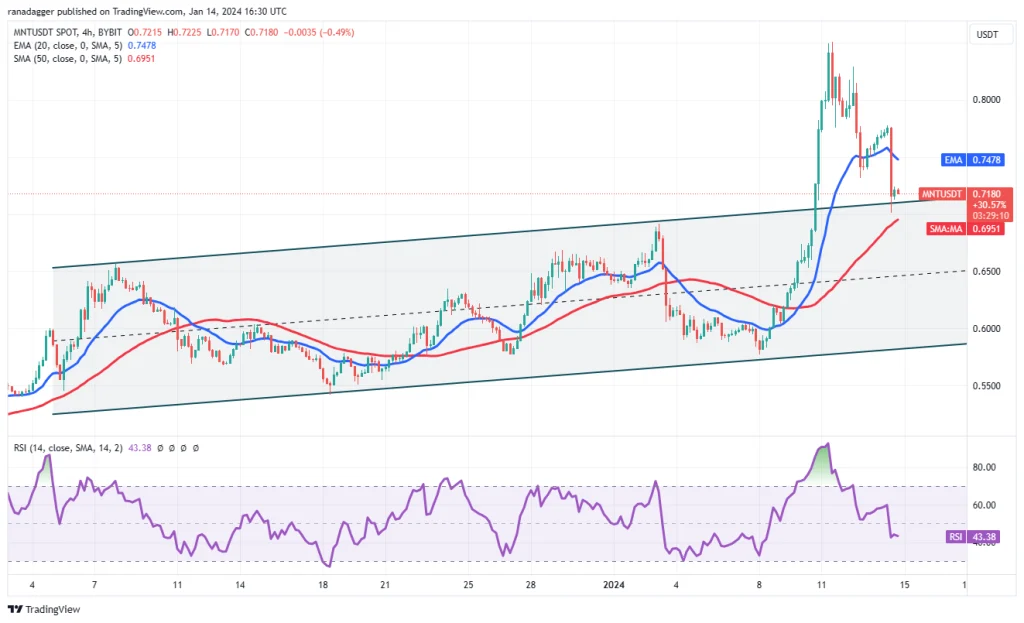
4-hour Mantel price chart.

As can be seen from the 4-hour view, the buyers first tried to stop the price correction at the 20 candle moving average, but the sellers had another plan. They started selling again after the price bounced and caused the price to fall near the 50 candlestick simple moving average. Any attempt to recover the price will now be met with resistance at the EMA level of 20 candles. Therefore, buyers need to break through the resistance zone between this moving average and $0.78 for bullish signals to be received from the market.

On the other hand, if the downtrend continues and the 50 candlestick simple moving average is broken, it will mean that the uptrend is probably over. In such a situation, we face the risk of falling to $0.65 and then $0.58.

Sei price analysis (SEI)

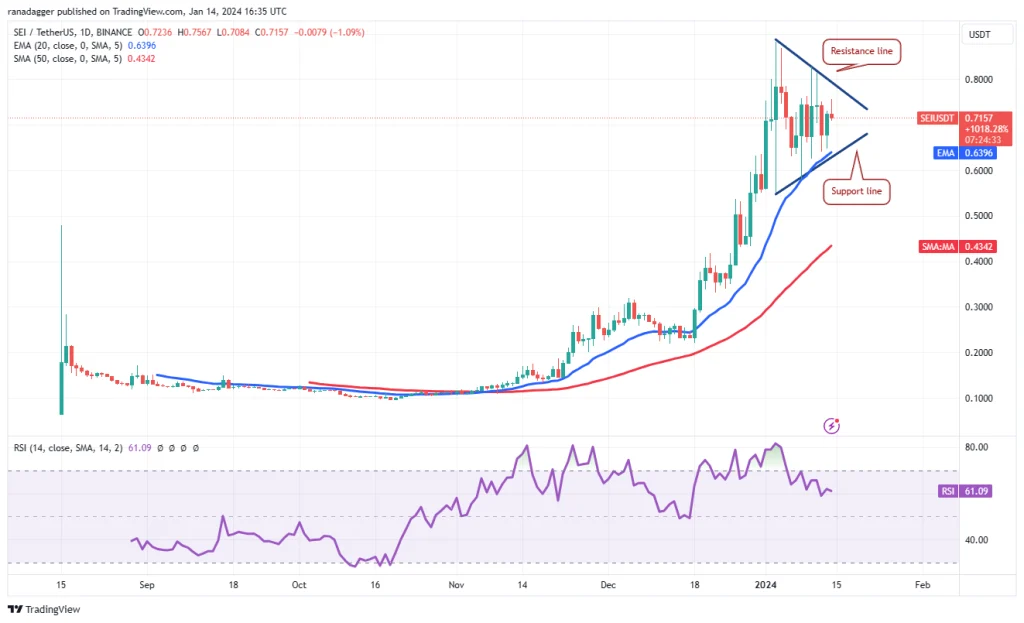
Thirty symmetrical triangle patterns are formed on the one-day chart, which clearly shows indecision between buyers and sellers.
Bitcoin price analysis + 5 digital currencies that you should keep an eye on this week
One-day price chart of C.

The symmetrical triangle is mostly known as a trend continuation pattern, but in rare cases it can also act as a trend reversal pattern.

The upward slope of the 20-day moving average ($0.64 level) and the placement of the relative strength index in the positive area indicate the superiority of buyers. Now, if the buyers can bring the price above the resistance line of the symmetrical triangle pattern, it means the resumption of the upward trend. The target of the pattern in this situation is the $1.10 level.

This bullish outlook will be invalidated if it loses the thirty symmetrical triangle support on the chart. This event can be considered as a signal to change the trend and continue to correct the market to the 50-day simple moving average at $0.43.
Bitcoin price analysis + 5 digital currencies that you should keep an eye on this week
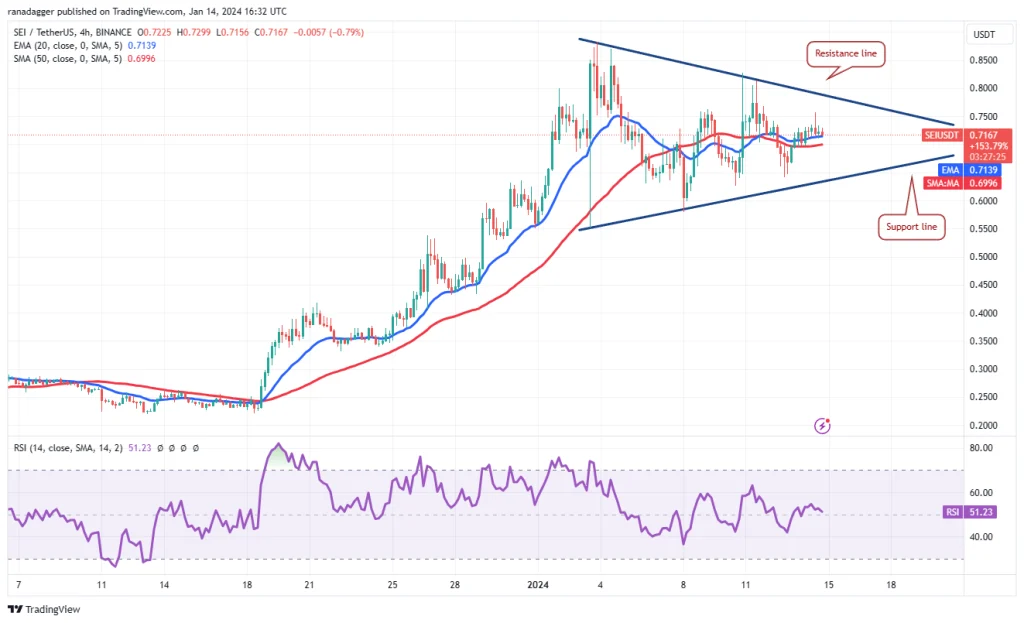
4-hour price chart of C.

In the 4-hour timeframe, the moving averages have a neutral slope and the relative strength index oscillates near the middle axis, which indicates a balance between supply and demand. Predicting the price path when the pattern breaks (up or down) is currently difficult. Therefore, it is recommended to wait until the support or resistance triangle is broken on the chart.

If the price of C stays above the moving averages, buyers can try to break the resistance of the pattern. On the other hand, if the price breaks below the moving averages, we may see a drop of 3 to the moving averages on the chart.

to the articleVote:

دیدگاهتان را بنویسید

Digital currencyEconomicalارز دیجیتالاقتصادی

Bitcoin price analysis + 4 digital currencies that you should keep an eye on this week


Due to the imminent announcement of the result of the decision of the United States Exchange Commission on the applications for the launch of Bitcoin Cash ETF in this country, it seems that Bitcoin buyers are ready to enter the market. Analysts expect the US Securities and Exchange Commission to comment on applications for Bitcoin Cash ETFs between January 8 and 10 (December 18-20).

Will Bitcoin price jump with the approval of one or more cash ETFs? This is the question that has confirmed the minds of investors these days. It is normal for the price to rise after the official news of the approval of the first ETF. However, according to the traditional rule “Buy with rumors and sell with news” It is expected that after the initial excitement subsides, a part of the traders will try to save profits.

Digital currency market map.

Failure to approve requests to launch a Bitcoin Cash ETF could lead to a mass selloff in the market. Of course, due to the closeness of the next Bitcoin halving in April (April 1403), the start of a full-fledged bear market is out of the question. Meanwhile, the hope of confirmation of cash ETFs on another date can encourage buyers to enter price floors.

In the continuation of this article, we have presented the price analysis of Bitcoin and 4 other digital currencies in one-day and 4-hour time frames.

Bitcoin (BTC) price analysis

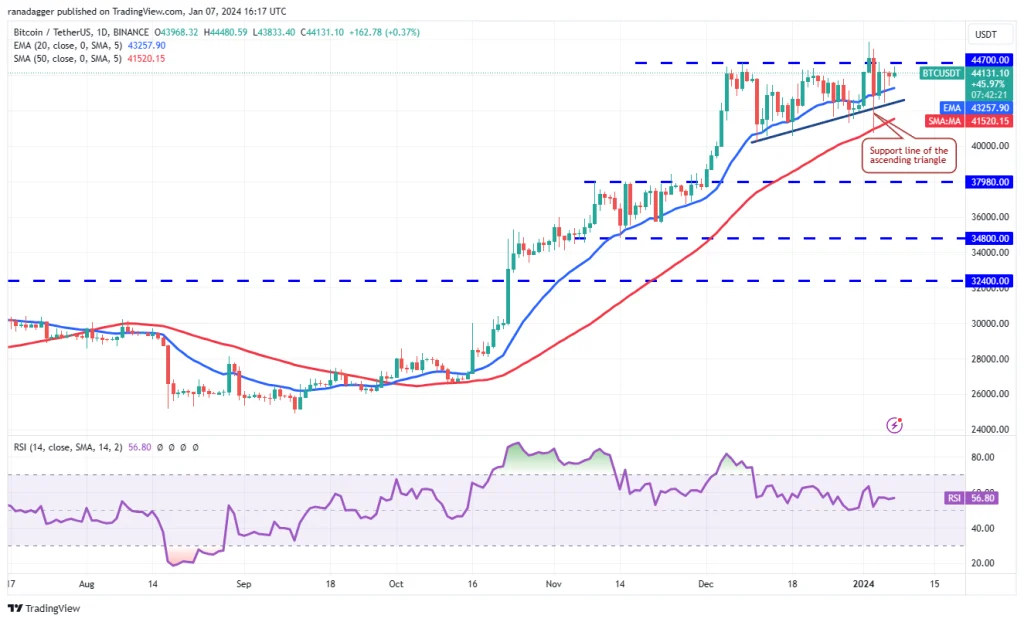
On January 5th (15th), Bitcoin recorded the Doji candlestick pattern on its daily chart, followed by the Inside-day candlestick pattern on January 6th (16th), which shows the indecision of buyers and sellers. Gives. The Inside Day candlestick pattern is formed when the one-day candlestick is completely formed (including the candlestick shadows) within the range of the floor and ceiling (High & Low) of the previous candlestick.

Bitcoin price analysis + 4 digital currencies that you should keep an eye on this week
One day Bitcoin price chart.

One promising note is that the price is still oscillating within the ascending triangle pattern on the chart. This bullish setup is completed by crossing and closing the price candle above the level of $44,700. In such a situation, the way for the price to jump towards the target of this pattern is opened at $49,178, and then it will be the turn of $52,000.

The support of the triangle pattern is also considered as one of the important levels that you should monitor if the market goes down. The loss of this support may lead to a fall of Bitcoin to 40,000 and even $37,980 as the fall deepens. Of course, buyers are expected to strongly defend this level.

Bitcoin price analysis + 4 digital currencies that you should keep an eye on this week
4 hour chart of Bitcoin price.

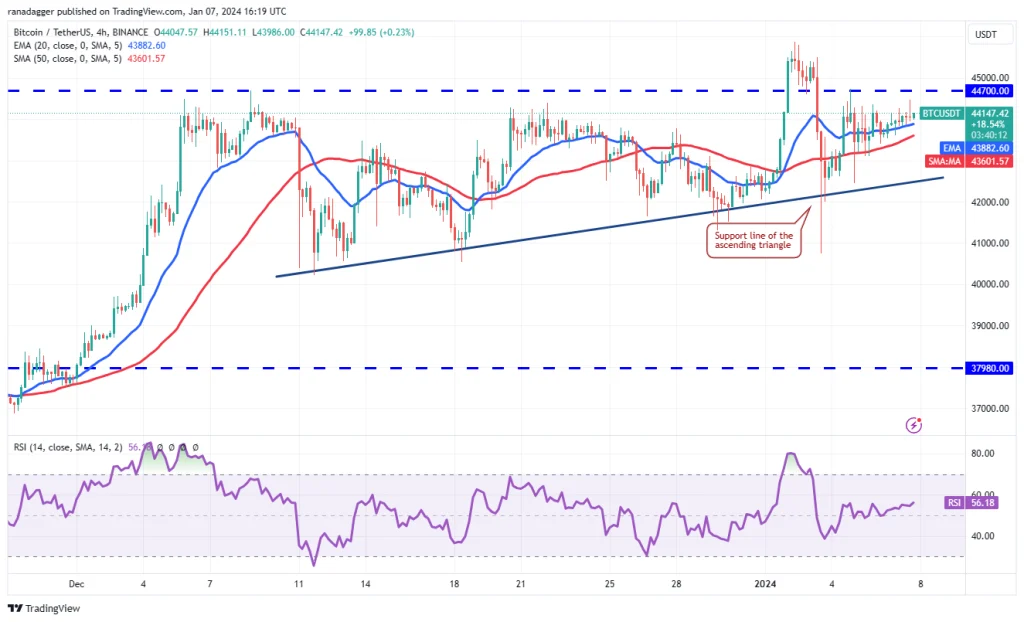
In the 4-hour view of the Bitcoin market, the EMA 20 candlestick (EMA 20 – blue line on the chart) is moving without a slope, and the relative strength index (RSI) is slightly above the middle axis (level 50), which is a total balance between It shows buyers and sellers in the market. The upward movement can continue with the crossing and closing of the price candle above $44,700, after which a slight resistance can be seen around $45,879. It is worth mentioning that crossing this resistance will increase the probability of Bitcoin jumping up to $49,178.

If the market is bearish, the price falling below the 50 candlestick simple moving average (SMA 50 – red line on the chart) will be a sign of a decrease in the strength of the buyers. After that, the risk of the price falling will intensify until the support of the triangle pattern on the chart. Buyers have no choice but to defend this level to maintain the bullish perspective of this pattern.

Internet Computer Price Analysis (ICP)

The internet is a multi-threaded computer that is experiencing a fast pullback, and as it turns out, the previous buyers of this digital currency are continuously leaving the market.

Bitcoin price analysis + 4 digital currencies that you should keep an eye on this week
One day chart of computer internet price.

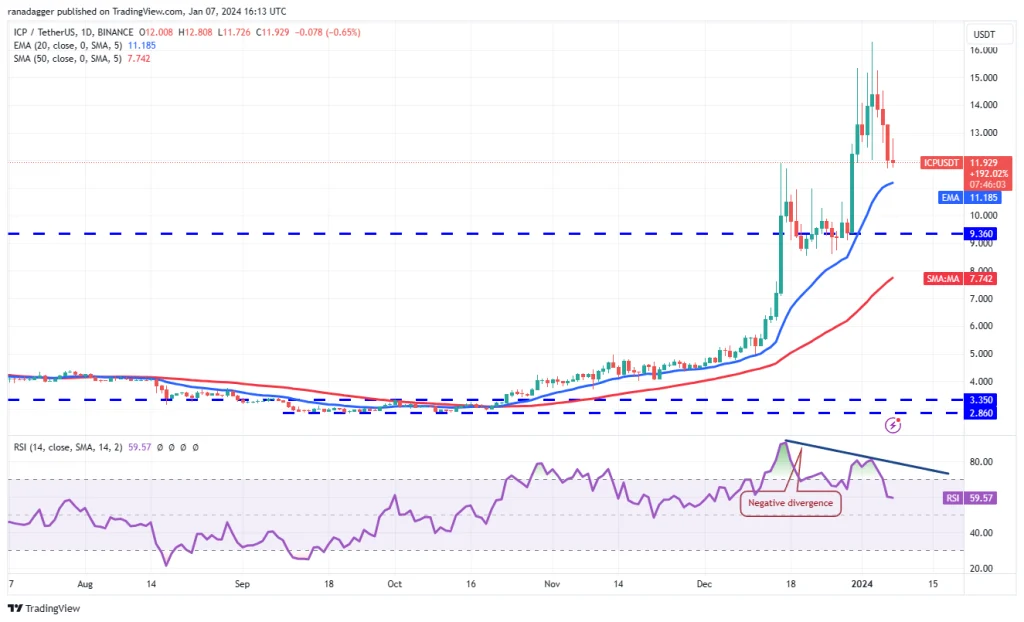
Buyers have an opportunity to stop further losses near the 20-day moving average ($11.18). If the price recovers strongly from this level, it means that traders’ sentiment towards the ICP is still positive and they are buying at the price floors. After that, conditions will be provided for the efforts of buyers to bring the computer internet to $14.40 and then $16.

The negative point of the ICP one-day view is the formation of a negative divergence between the price and the relative strength index, which shows the weakness of the trend. A drop and close of the daily candle below the 20-day EMA will mean that the short-term uptrend is over.

Bitcoin price analysis + 4 digital currencies that you should keep an eye on this week
4-hour chart of computer internet prices.

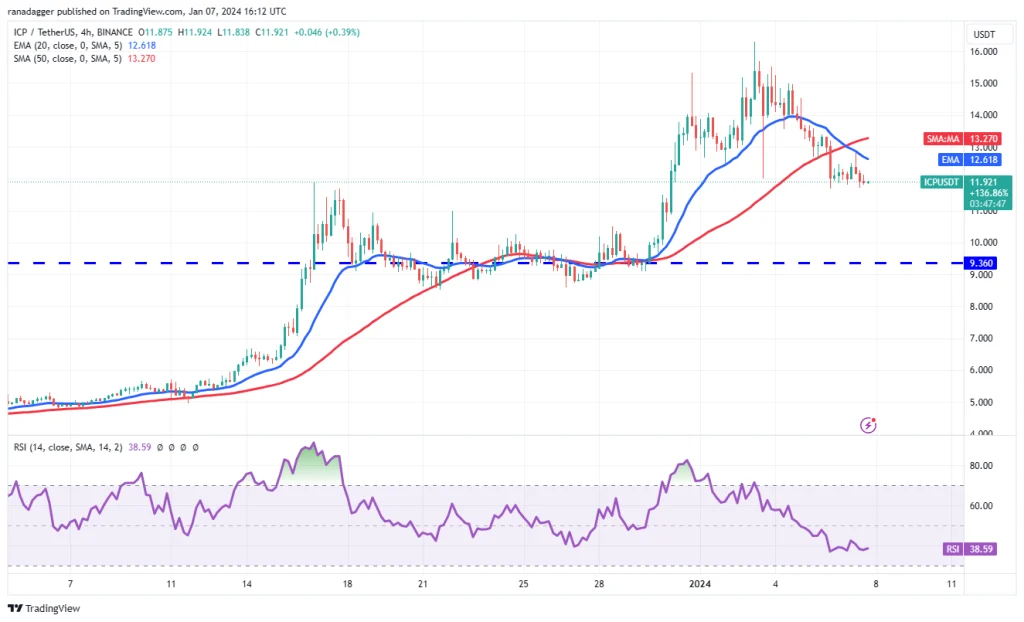
On the 4-hour view, the EMA of 20 candlesticks has completed a bearish breakout after breaking the SMA of 50 candles downwards, which means that in the short term the conditions are in favor of sellers. If the price continues to fall below $11.70, the path will open for a further fall to $11 and then $9.36.

The end of the bearish correction can be confirmed when the candlestick buyers push the price above the moving averages and consolidate their position after this high. In this case, he can expect the price to jump up to 15 and then 16 dollars. At the same time, it is expected that the strength of the sellers will increase again by approaching 16 dollars.

Arbitrage Price Analysis (ARB)

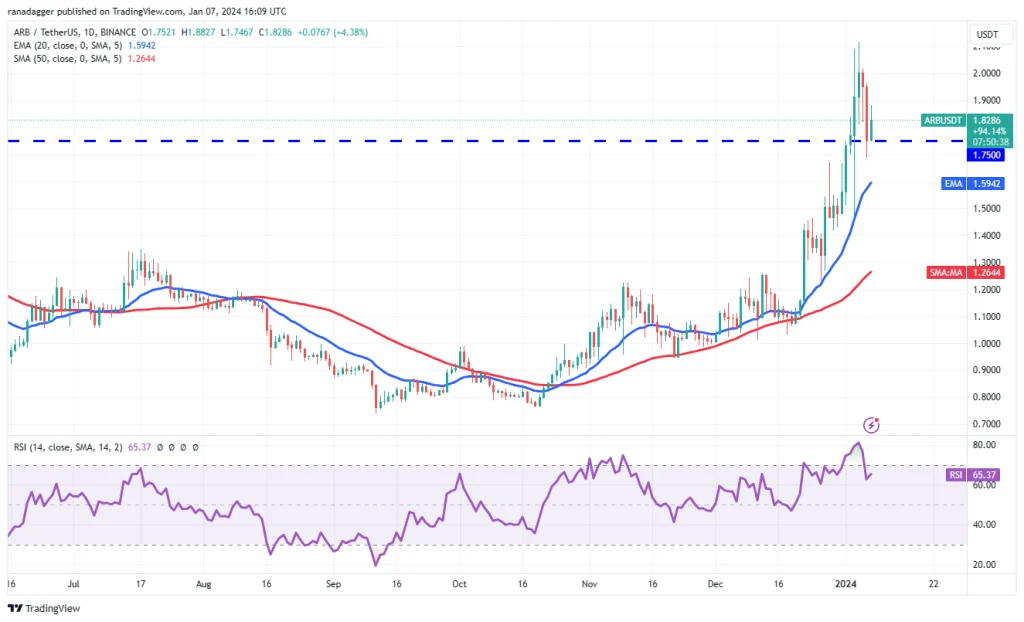
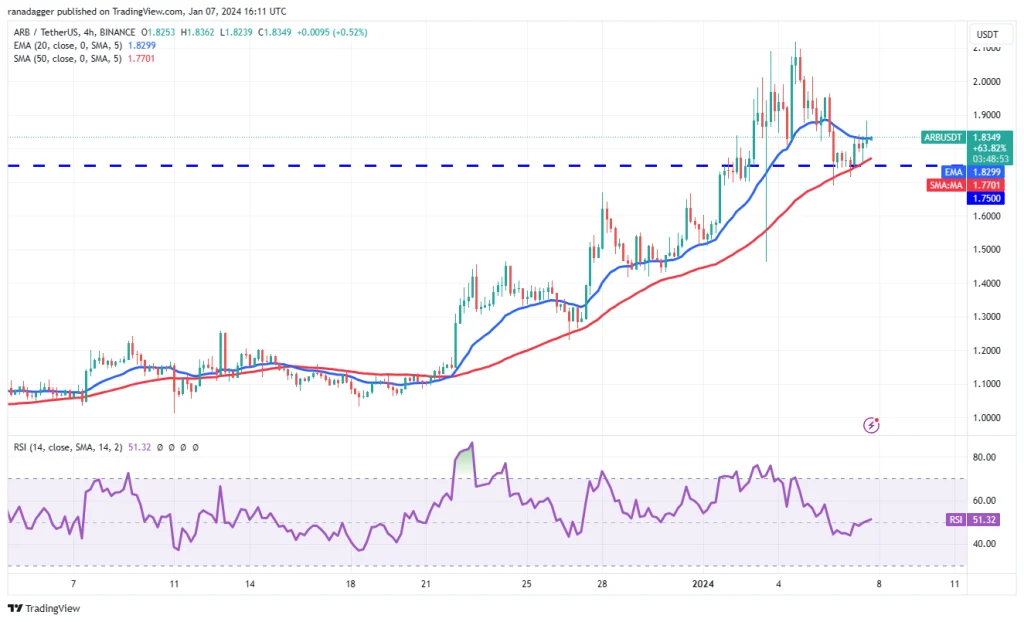
Arbitrum failed to maintain its position above $2, and probably this is the reason why a part of the market was encouraged to save profits and the price went down to the breaking level of $1.75.

Bitcoin price analysis + 4 digital currencies that you should keep an eye on this week
Arbitrum one day price chart.

At the limit of $1.75, a tough competition between buyers and sellers of arbitrage is expected. If the conditions progress in such a way that the price returns strongly from this level upwards, it can be said that the buyers have turned this level into support. In this case, the possibility of price growth will increase until the peak of January 4 (December 14) at $2.11. The next wave of this upward move can be a jump up to $2.50.

On the other hand, if the $1.75 level is missed, Arbitrum’s price is likely to drop to the 20-day moving average at $1.59. Buyers should defend this level with all their strength, because breaking it could lead to arbitrage down to $1.35.

Bitcoin price analysis + 4 digital currencies that you should keep an eye on this week
Arbitrum 4-hour price chart.

In Arbitrom’s 4-hour market view, it can be seen that the price has recovered somewhat from the $1.75 level, but is facing a tough resistance in the 20 candlestick EMA range. This is not a good sign, because it can be interpreted that traders see any increase in price as an opportunity to sell. Sellers are also looking to put themselves in a better position by dragging the price below the 50 candlestick simple moving average. If they manage to do this, we should probably wait for Arbitrum to drop to $1.50.

To avoid this drop, buyers should quickly push the price above the 20 candlestick EMA and then the upper resistance at $1.96. In this case, they will have a chance to test the $2.12 resistance once again.

STX price analysis

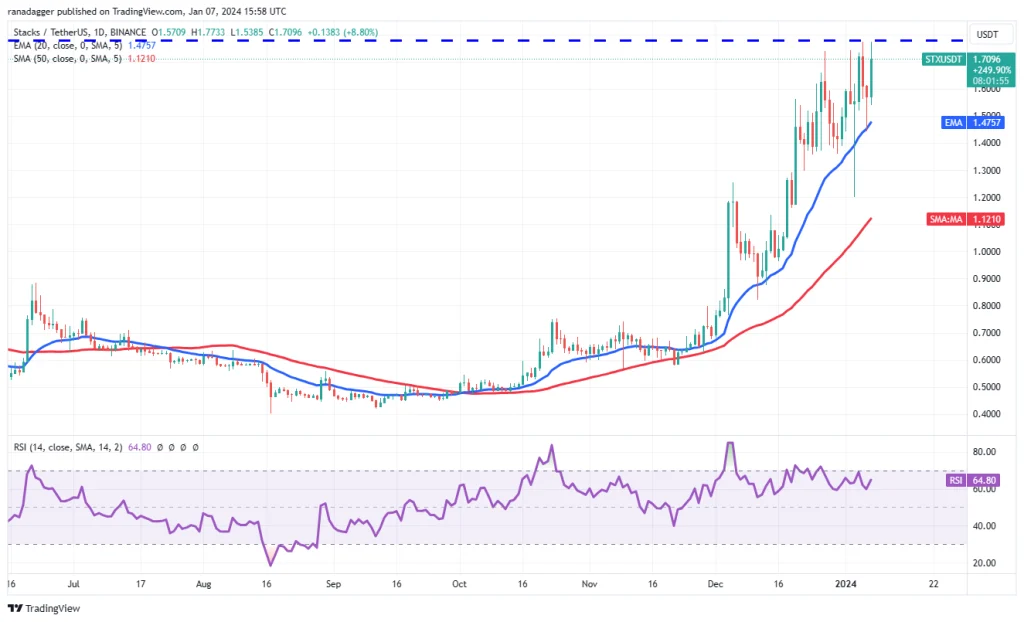
Stax recently experienced a rebound from the upper resistance at $1.78, but as you can see from the one-day chart, this pullback was short-lived.

Bitcoin price analysis + 4 digital currencies that you should keep an eye on this week
One-day stock price chart.

The price on January 6 (16) experienced an upward return from the level of the 20-day moving average ($1.47), which clearly shows the action of a part of the market to buy at the price floors. Buyers have now pushed the price to the $1.78 mark and are expected to face a lot of effort from sellers in this range. If STX buyers succeed in crossing this resistance, the price can grow up to $2.20 and then $2.50.

On the other hand, a rapid downward return of the price from this level can lead to the continuation of the price fluctuation between $1.78 and the 20-day moving average for several days. It should be mentioned that the price falling below the moving average can open the way for a further drop to $1.20.

Bitcoin price analysis + 4 digital currencies that you should keep an eye on this week
4-hour STX price chart.

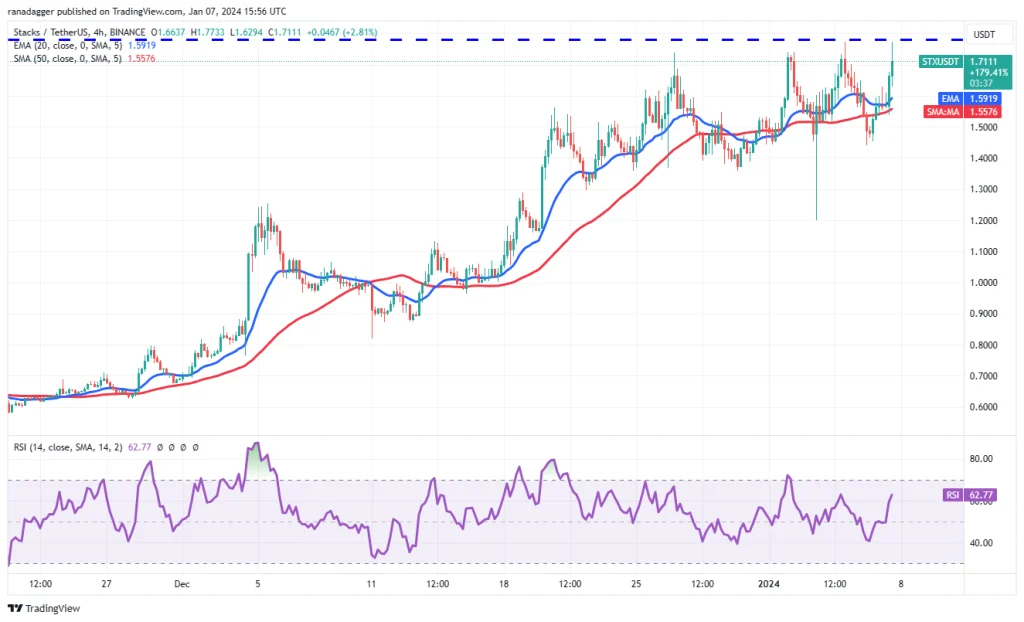
On the 4-hour chart, the closeness of the price to the resistance of $1.78 attracts attention. If the buyers manage to cross this level, it can be said that the next wave of the upward trend of Stax has started, and after that it will be the turn of the $2 target.

On the other hand, the rapid downward correction of the price from the $1.78 level shows the resistance of sellers in this range. In this case, it is possible that the price will first fall to the moving averages and then $1.36. Besides, the return of Stax from $1.36 can keep the price between this level and $1.78 for some time.

Maker price analysis (MKR)

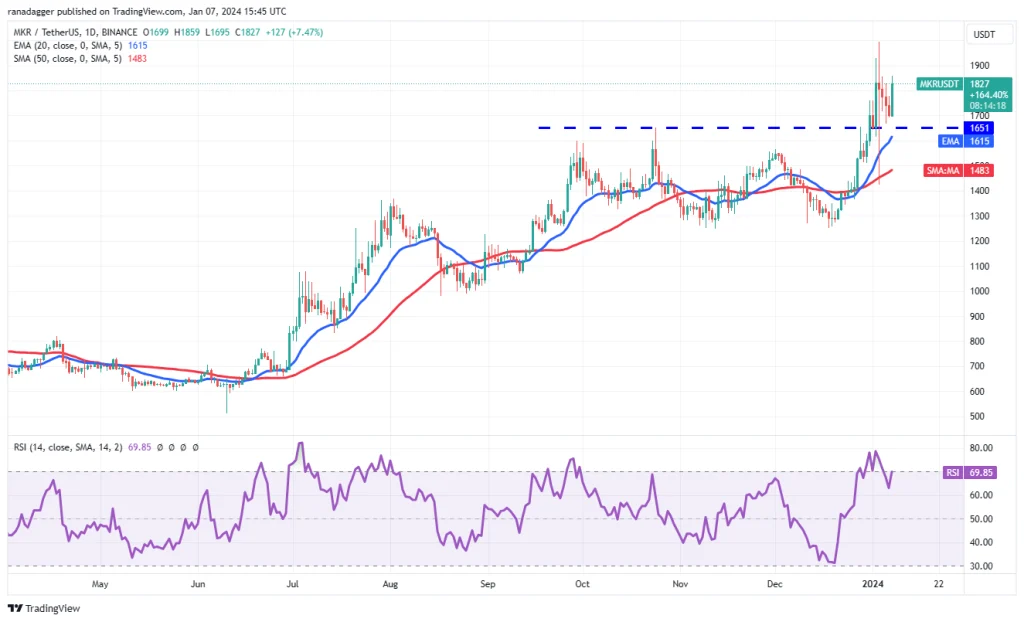
Maker has recently completed a pullback on its uptrend and as you can see from the chart, buyers have not let the $1,651 breakout level be missed.

Bitcoin price analysis + 4 digital currencies that you should keep an eye on this week
One day price maker chart.

The 20-day exponential moving average (at $1,615) has taken an upward slope, and the relative strength index is at the border of the overbought range, which shows the dominance of buyers on the market. Holding the $1,651 level means that buyers have turned it into a support, after which it opens the way for MKR to jump to $2,000.

If the market goes down, the 20-day moving average is an important level that you should monitor. A break of this level could lead to a drop to the 50-day SMA at $1,483.

Bitcoin price analysis + 4 digital currencies that you should keep an eye on this week
4-hour price maker chart.

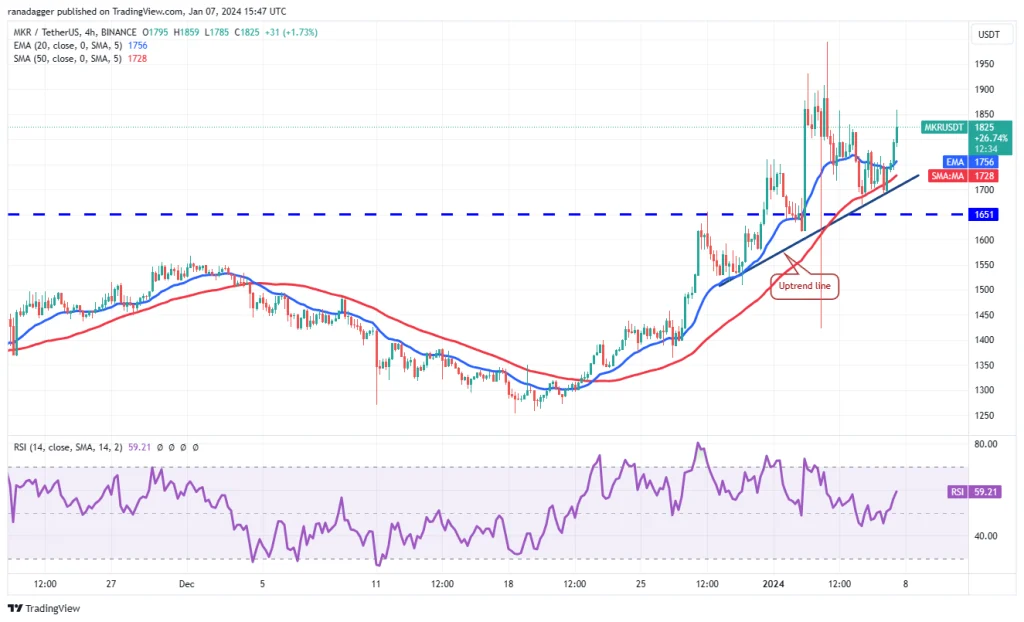
As it can be seen from the 4-hour view of the market maker, a part of the market has bought at the floor when the price reached the upward trend line on the chart. Buyers have pushed the price above the EMA of 20 candles and are trying to extend this bullish correction by crossing $1,825. If they succeed in doing so, Maker could first reach $1,900 and then $2,000.

To weaken the trend, sellers should push the price below the uptrend line on the chart, and the bearish trend will intensify when the $1,651 support is broken. After that, the price of MKR may fall to $1,500.

to the articleVote:

دیدگاهتان را بنویسید

دکمه بازگشت به بالا