Digital currency price analysis; 5 currencies that you should keep an eye on this week

The recent upward trend of the US stock market stopped last week and many indices closed in losses. Traders seem to have started to save profits due to the release of important economic data this week.
In the past week, the important stock market index “S&P500” experienced a 3.37% drop. Bitcoin, however, did not follow the stock market during this period. This means that digital currency traders no longer panic and sell in a hurry every time the price drops in the stock market.
The horizontal and limited volatility of Bitcoin shows that traders are waiting for the announcement of the new bank interest rate in the United States on December 14 before deciding on their trading positions. However, this issue has not stopped the volatility of all altcoins, and there are promising signs on the charts of some of them.


In the rest of this article, we will examine the status of the Bitcoin chart and some of these altcoins.
Bitcoin (BTC)
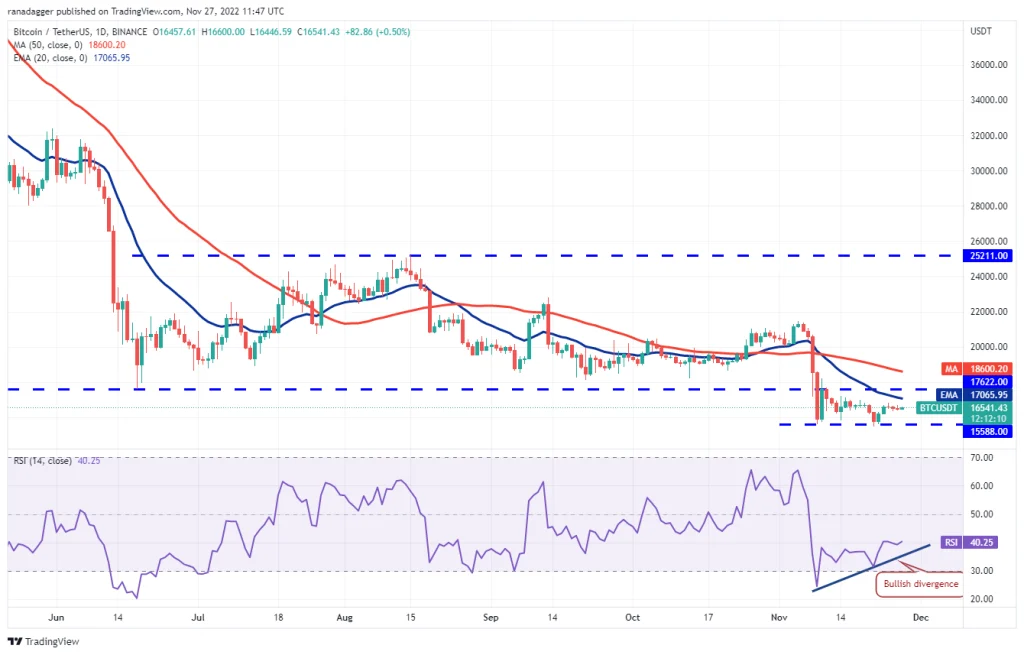
Bitcoin has been hovering around its 20-day exponential moving average (EMA 20 – blue line in the picture) for the past few days. The neutral slope of this moving average and the placement of the relative strength index (RSI) near the middle axis (level 50) also mean that none of the two poles of the market (buyers and sellers) is superior to the other.
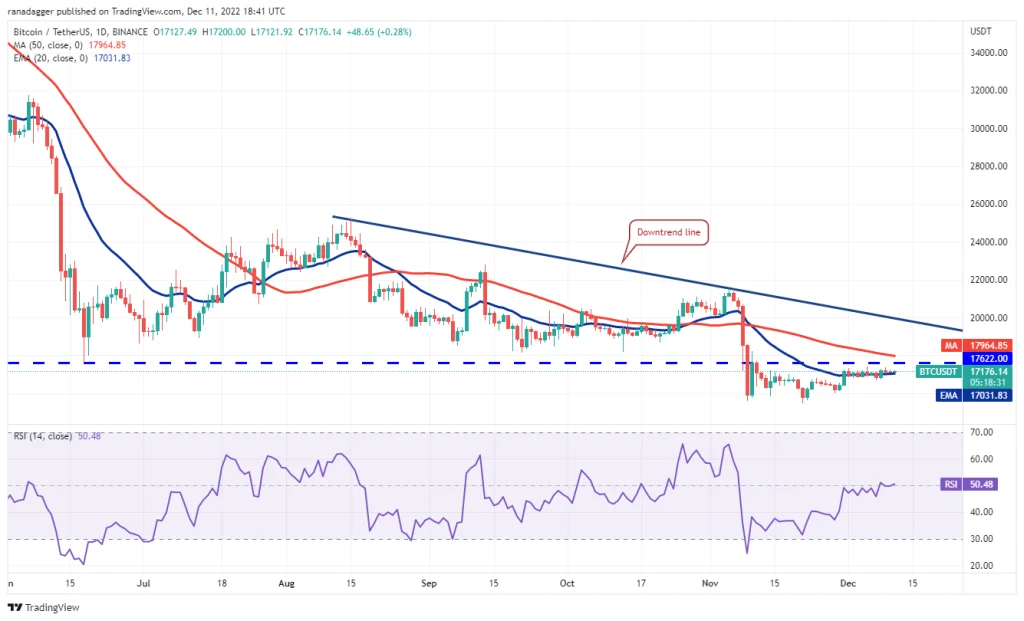
Assuming the price trend continues to rise, $17,622 could be the first key hurdle for Bitcoin. Crossing this level can provide the conditions to start a new upward movement to the downtrend line on the chart. At the same time, sellers are expected to defend this level with strength.
Now, if Bitcoin returns to the bottom after hitting the downward trend line on the chart; But it still remains above $17,622, which means buyers have turned this level into a support. With this incident, we can have more hope for breaking the resistance of the downward trend line of Bitcoin for the next days. After that, $21,500 will be the next target for Bitcoin buyers.
Conversely, a fall below $16,678 could increase the strength of sellers and may lead to a price drop to $15,995.
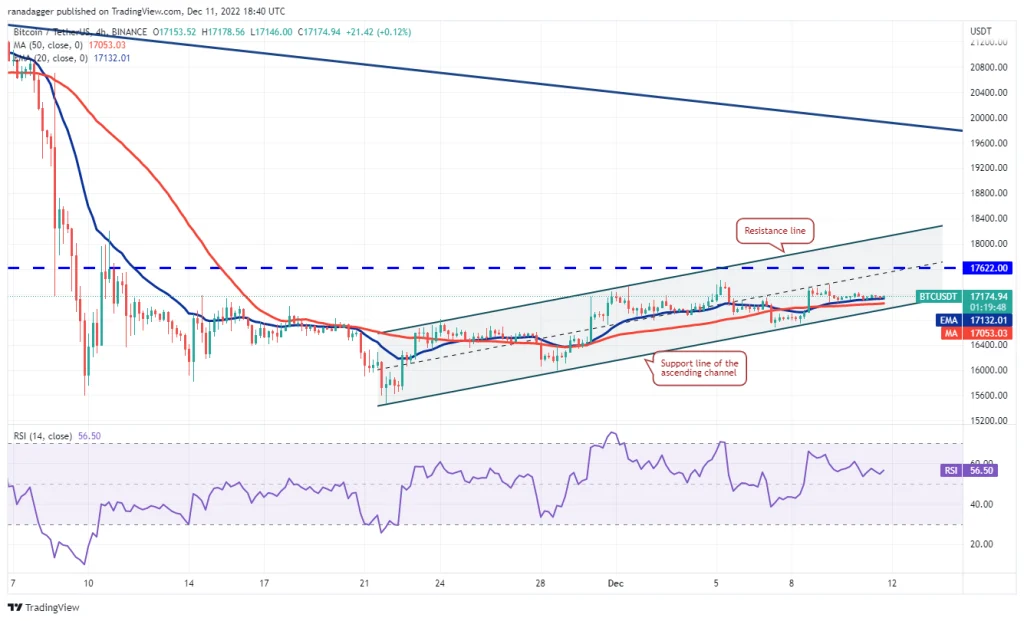
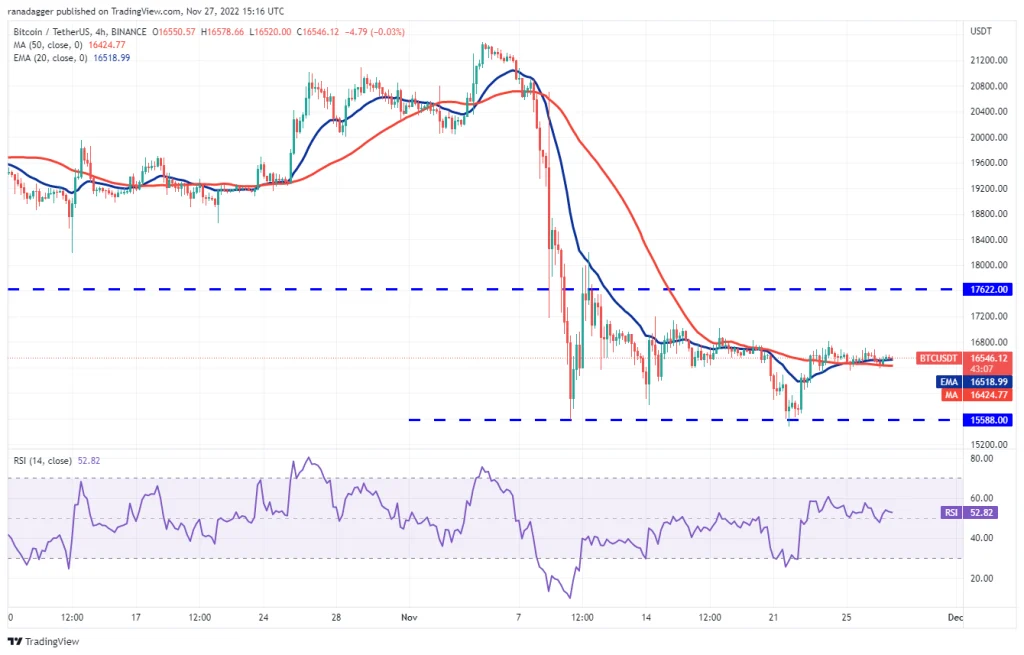
In the 4-hour view of the Bitcoin market, the limited fluctuation of Bitcoin can be seen in an upward channel, and the sellers have also managed to keep the price candle in the lower half of this channel, which means that every time the price increases, part of the market participants sell. Losing the support of the moving averages on the chart may further lead Bitcoin to fall to the bottom of this ascending channel. The inability of buyers to maintain the support of the bottom of the channel also increases the possibility of a drop in the price of Bitcoin to $16,678 in the short term.
Now, if the price moves up from the current levels or the support of the ascending channel floor on the chart, it means that part of the market is still buying at the price floors. After that, the way will be opened for Bitcoin to jump to the upper resistance at $17,622. The next target of buyers will be the ceiling of this ascending channel.
Monero (XMR)
Monero has been oscillating in a bearish angle pattern for several days. The upward slope of the 20-day moving average and the positioning of the relative strength index in the positive zone means that buyers are currently in control of the market.
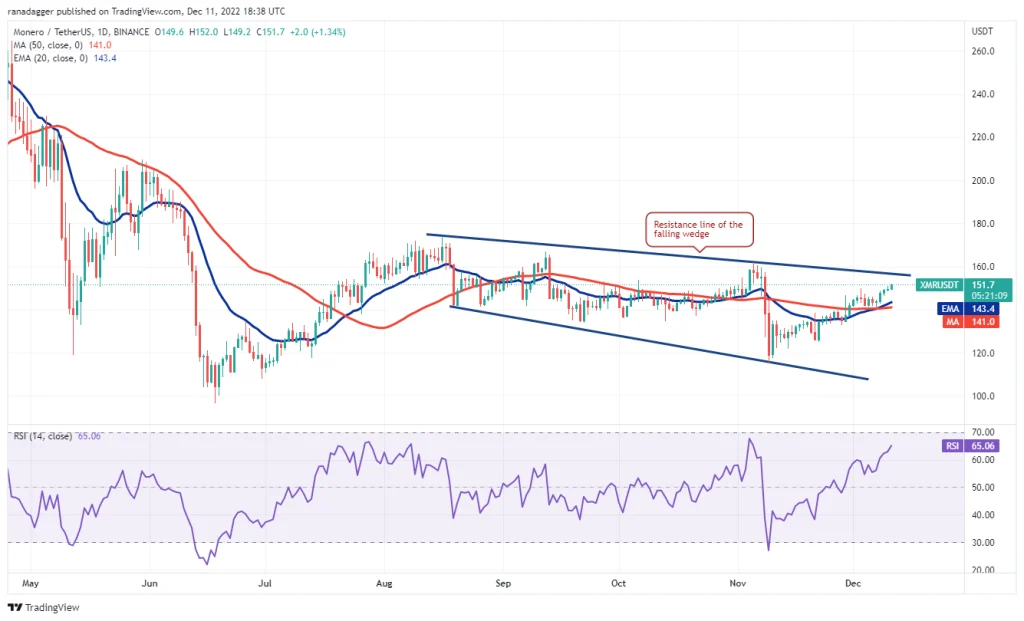
Monero now has a chance to pull itself up to the corner pattern resistance on the chart, and of course, it is expected that a part of the market will sell when the price reaches this level. A price break from this resistance and Monero reaching below the moving averages means that Monero will probably fluctuate within the pattern for a few more days.
On the other hand, if the buyers manage to cross the resistance of the corner pattern, then we can expect a change in the overall market trend in the short term. Following this path, $174 will be Monero’s next target, and breaking it means that the recent downtrend of this digital currency is probably over.
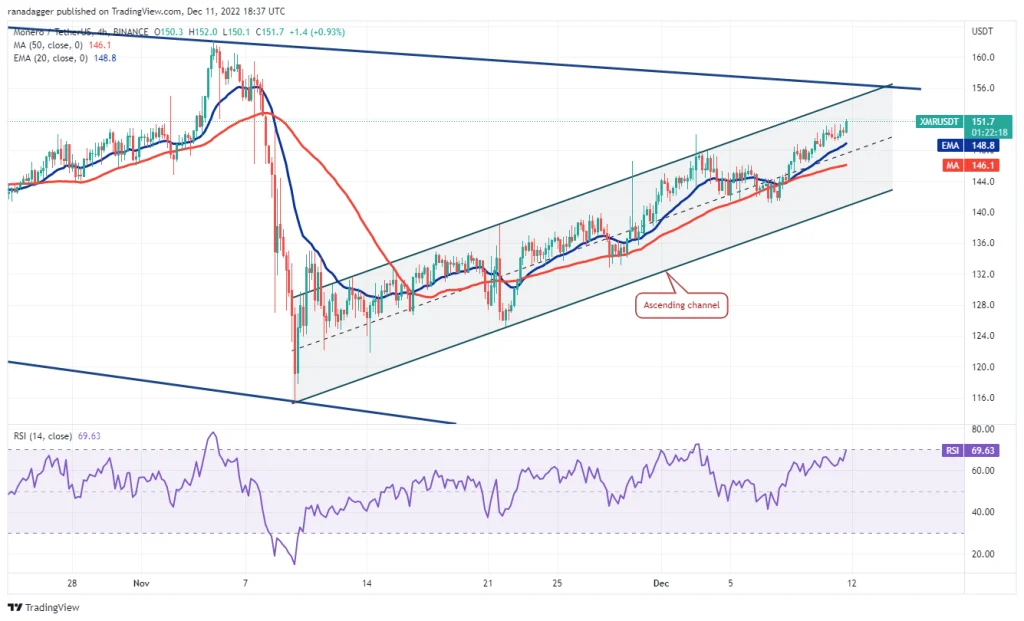
In the 4-hour view of the Monero market, the price has been moving in an ascending channel for a relatively long time. This means that in the short-term view, traders’ sentiments remain positive and sell at price floors. Having said that, the price could follow its recent uptrend and take Monero to the channel resistance at $156, crossing which would be a trigger to reach $162.
The first sign of a weak trend in the market can be the breaking of the moving averages on the chart. After that, the path opens for the price to fall to support the bottom of the channel, and if this level is broken, one should wait for the start of a downward movement with a target near $133.
Ton Coin (TON)
The price of TonCoin has just broken out of the symmetrical triangle pattern on the one-day chart, which shows that the recent uncertainty ruling the market of this digital currency has ended in favor of buyers. A symmetrical triangle is usually referred to as a continuation and bullish pattern, and this issue increases the possibility of resuming the bullish trend.
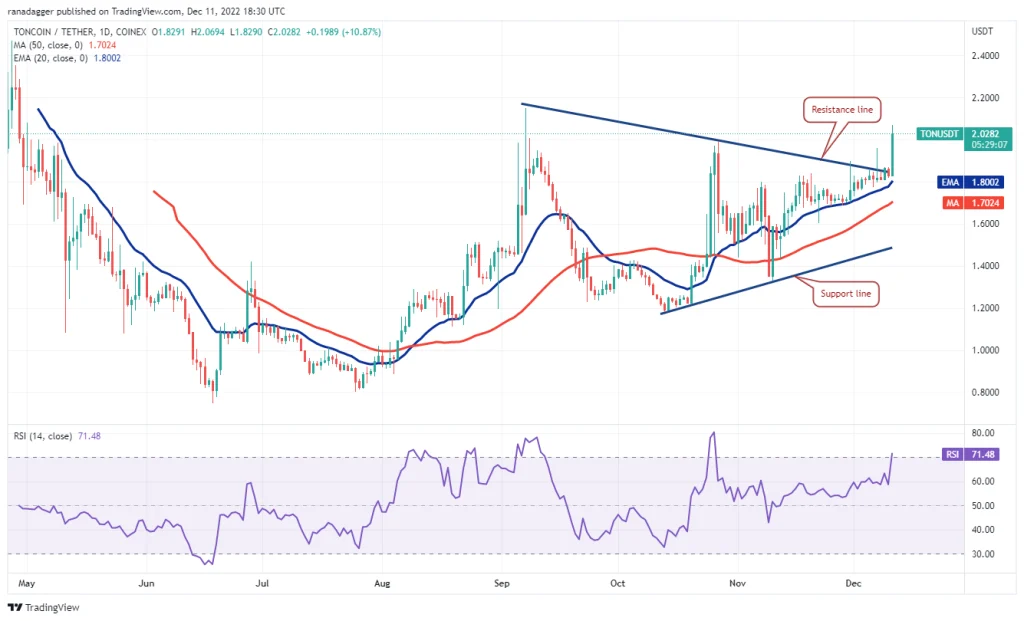
If the buyers continue to manage to keep the price above the symmetrical triangle, TonCoin will have the opportunity to try to break through the upper resistances at $2 and $2.15. Crossing the mentioned resistances will probably lead to an increase in the upward momentum of the price and will open the conditions to move towards the $2.87 target of the pattern.
On the other hand, if the buyers are unable to hold the price above the symmetrical triangle pattern on the chart, it means that part of the market is still selling as the price rises. A break of the 50-day simple moving average support (MA 50 – red line in the image) at $1.70 could also trap buyers and push the price down to the bottom support of the pattern.
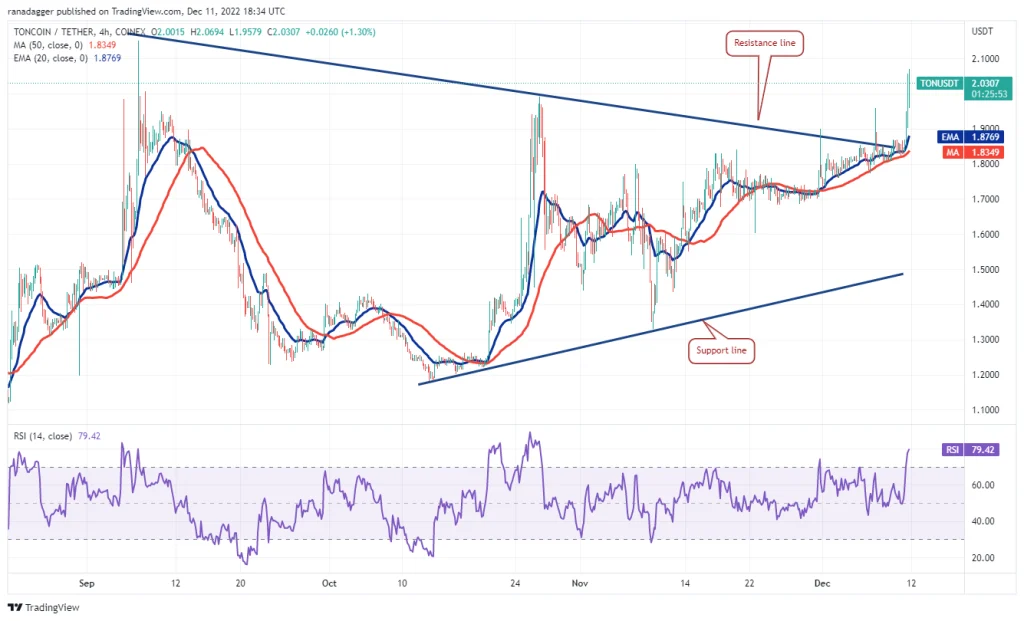
In the 4-hour view of the Tooncoin market, the moving averages have taken a completely upward slope, and the relative strength indicator is in the “saturation of buying” area, which means that buyers control the market. TonCoin may face an obstacle at the $2 level on its upward path; But if the buyers overcome this obstacle, the upward acceleration of the price will increase.
On the other hand, a fall from the current levels and a break of the 50 candlestick simple moving average support could intensify the selling pressure and push the price down to $1.70. This level is of particular importance and if it is broken, it should be said that the sellers have dominated the market again.
Trust Wallet Token (TWT)
The continuation of the upward trend in the Trust Wallet Token market means that the traders of this digital currency sell at price peaks instead of hastily saving profits. This flow increases the possibility of the expansion of the upward trend.
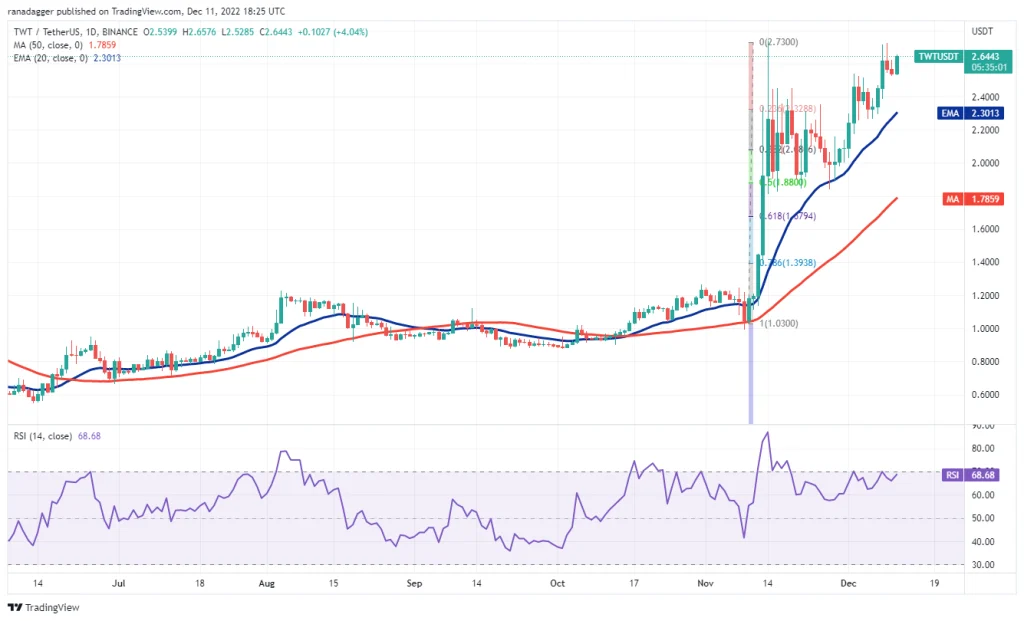
Buyers are now trying to push the price above the resistance of $2.73, and if they succeed in doing this, the way will be opened for Trust Wallet Token to jump up to the psychological resistance of $3; The level at which sellers are expected to show resistance when the price reaches it.
It should be noted that a break above $3 can also bring TrustWallet to the bullish flag pattern target on the chart at $3.51.
Sellers may have drawn another plan for the price and at $2.73 prevent the Trust Wallet price from rising. In this case, in order to prove their dominance on the market, it is necessary to break the 20-day EMA support at $2.30.
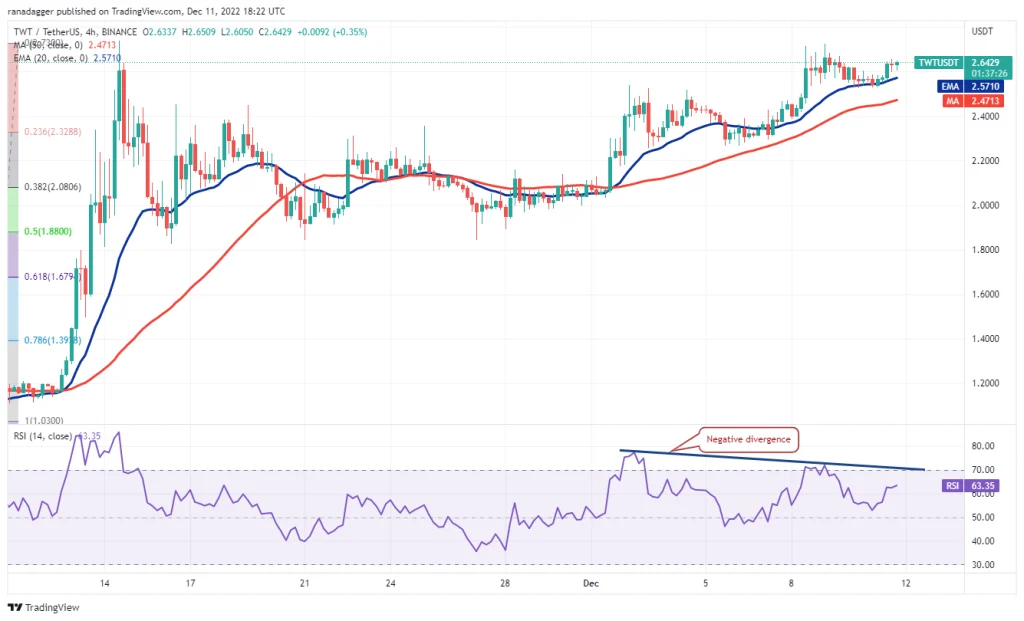
As can be seen from the 4-hour view of the TrustWallet Token market, buyers increase their activity every time the price drops to the vicinity of the moving averages. Although the moving averages have taken an upward slope, the negative divergence between the price and the relative strength index indicates the possibility of a weakening of the upward trend. However, if buyers drive the price above $2.73, increased buying pressure could change this outlook.
If the market goes down, moving averages become more important; Because the loss of the support of the 50 candlestick simple moving average can encourage some short-term traders to exit the market and push the price down to $2.25 or even $2.
Oxy Infinity (AXS)
Oxy Infiniti has recently followed a strong downtrend; But the first signs of a possible change in the market of this digital currency are emerging. Buyers on December 5 (Azar 14) pushed the price above the downward trend line on the chart and as it can be seen from the long shadow of the candle of this day, they failed to maintain their position above this trend line.
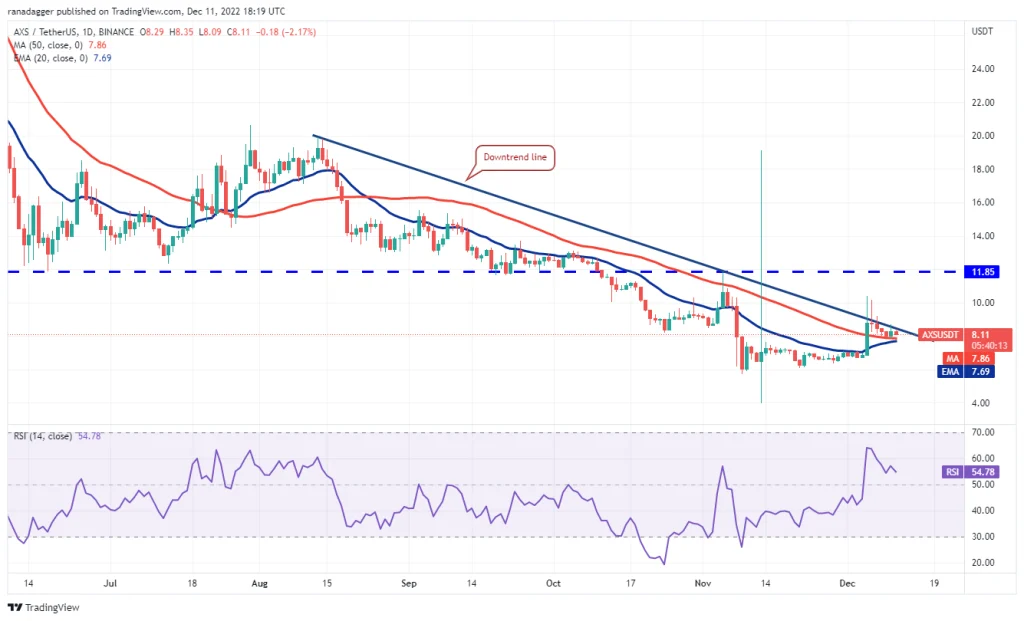
On a positive note, buyers have so far not allowed the price to fall below the moving averages on the chart, meaning that these levels have become new price supports.
Oxy Infinity’s 20-day and simple 50-day exponential moving averages are on the verge of forming a bullish intersection, and the relative strength index is now fluctuating in the positive zone, which means that we can hope for a change in the trend in favor of buyers. If the price continues to cross the downward trend line on the chart and can maintain its position above this level, the way for the price jump to $11.85 will be opened.
Meanwhile, losing the support of moving averages can completely invalidate this bullish outlook. In this case, a downside target of $6.57 will be activated for Oxy Infiniti.
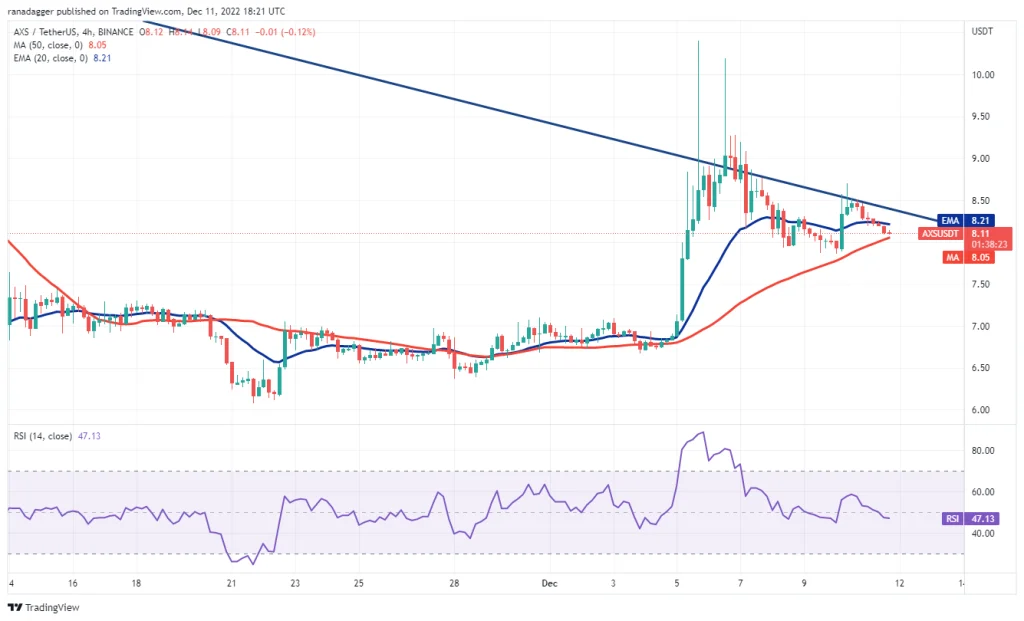
As can be seen from the 4-hour view of the Oxy Infinity market, sellers are strongly defending the downward trend line on the chart, and buyers are becoming more active at the price floors near the 50-candlestick simple moving average. The exponential moving average of 20 candles has assumed a neutral slope, and the relative strength index is near the level of 47, which means that there is a balance between supply and demand in the Oxy Infinity market.
Crossing the price of $8.70 can upset this balance in favor of buyers and open the way for the price to jump up to $9.28 and then $10. On the other hand, a drop below $7.86 would indicate that the sellers are back in control of the market, and then a drop to $6.87 is likely.