2 important indicators that show that the price floor of Bitcoin is forming

Bitcoin’s decline below its realized price in all previous market cycles has been a sign of the end of the bearish trend; But how much time is needed to be able to say that the market correction is complete and a full-fledged upward trend is ahead?
To Report Crypto Slate, determining the market price floor requires the examination of various sets of data. However, 2 such widely used indicators (on-chain) are very reliable in finding the bottom of the Bitcoin price; Realized price (Realized Price) and Z score of MVRV ratio or “MVRV Z-score”.
The realized price is the average purchase price of existing bitcoins divided by the total number of bitcoins in circulation. Realized price is a very important indicator and is considered as the basis of market cost.
The MVRV ratio Z score also uses the ratio of Bitcoin’s market value to its realized market value. In fact, this index determines whether the price is fair at this stage or not, according to the price deviation between the market value and the realized value of the desired asset.
Whenever Bitcoin trades below its realized price, the Z-score of the MVRV ratio falls below one. This means that the spot trading price of Bitcoin is lower than its closing price for investors and they have suffered an unrealized loss.
The Z-score of the MVRV ratio shows where the price support range is formed. Combining this ratio with the realized price indicator can signal traders when the price has reached a bottom.
In all previous bearish market cycles, we have seen the price of Bitcoin fall below the realized 200-week moving average. Since 2011, Bitcoin’s price has averaged 180 days below its realized 200-week moving average per cycle. Of course, this course lasted only 7 days in March 2020.
After the current bear market began with the collapse of the Terra network tokens in May, the price of Bitcoin remained below the realized price for 79 days. Although the price of Bitcoin was able to move above this index until the last week of August, it is still not possible to say whether this is a sign of the end of the bear market or not.
The only available signal is the formation of resistance at the $20,000 level. This resistance ultimately shows us the strength of the market and the lowest price it can fall to in the coming down cycle.
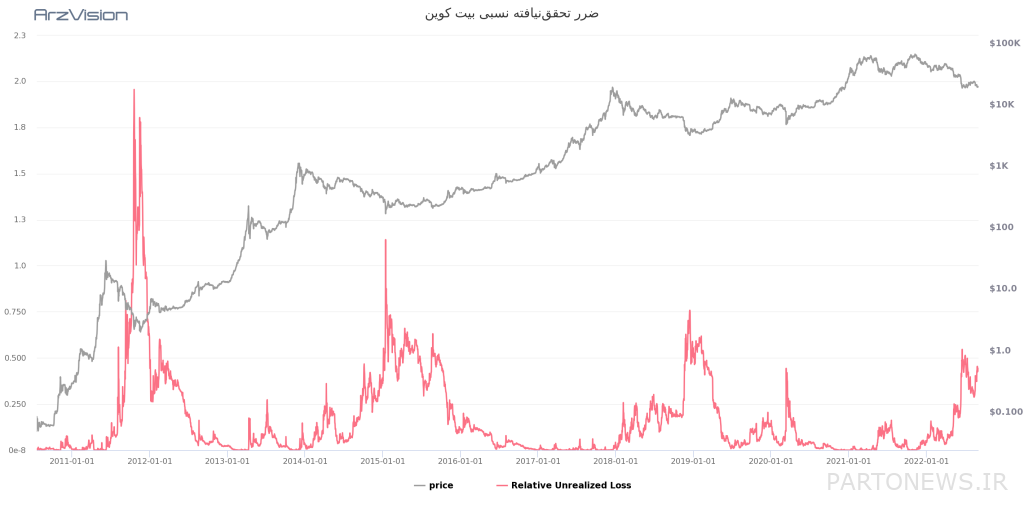
Based on the available data, the price of Bitcoin has seen an increase after a sharp jump similar to the one that occurred at the beginning of the summer Relative unrealized loss (Relative Unrealized loss) itself was in August. The relative unrealized loss index is the total dollar loss of all coins whose price at the time of purchase is greater than the current normalized (adjusted) market value. An increase in unrealized losses indicates that addresses are holding onto their bitcoins and not selling them at a loss, as opposed to a relative decline in the value of their holdings.

An examination of historical data shows that every time Bitcoin’s relative unrealized loss increases, the digital currency registers a higher price floor. In all previous similar cycles, Bitcoin has attempted to retest the high it experienced before the downtrend began; But it almost always fails to do so. This means that it has taken at least two years each time for the price of Bitcoin to reach the peak of its previous cycle.
All these data show that there is a possibility of forming a new price floor for Bitcoin. While this price floor could signal the beginning of an uptrend in the coming months, it will likely take two years for the market to fully recover and begin a full-fledged uptrend.

