3 important indicators that explain the reason for the decrease in the price of Solana

After Solana reached an all-time high of $260 in early November last year, some investors saw it as a serious competitor to Ethereum. However, the market’s 9th largest digital currency has been trading in the $35 range for more than 2 months, and a review of 3 key indicators shows that its price is in no rush to start an upward trend.
To Report Cointelegraph, Solana’s 29% price correction since August means that this digital currency has experienced a sharper fall than other altcoins. While the network has focused on providing low-fee, high-speed transactions, frequent outages have highlighted its centralization issue.
The last Solana network outage occurred on September 30, after a misconfigured validator stopped the blockchain. The presence of a duplicate node caused a fork in the network; Because the other nodes could not agree on the correct version of the blockchain.
Anatoly Yakovenko, the founder of Solana, recently proposed FireDancer, a scalable solution developed by JumpCrypto in collaboration with the Solana Foundation. This mechanism, which is designed to solve the long-term problem of network outages, should be ready for testing in the coming months.
Also, Solana-based decentralized exchange Mango Markets lost more than $115 million during a hack on October 11 (19). After successfully manipulating the collateral value of Mango’s native token, the attacker was able to withdraw a huge loan from the platform’s coffers.
The total value of the locked capital and the number of active Solana addresses have decreased
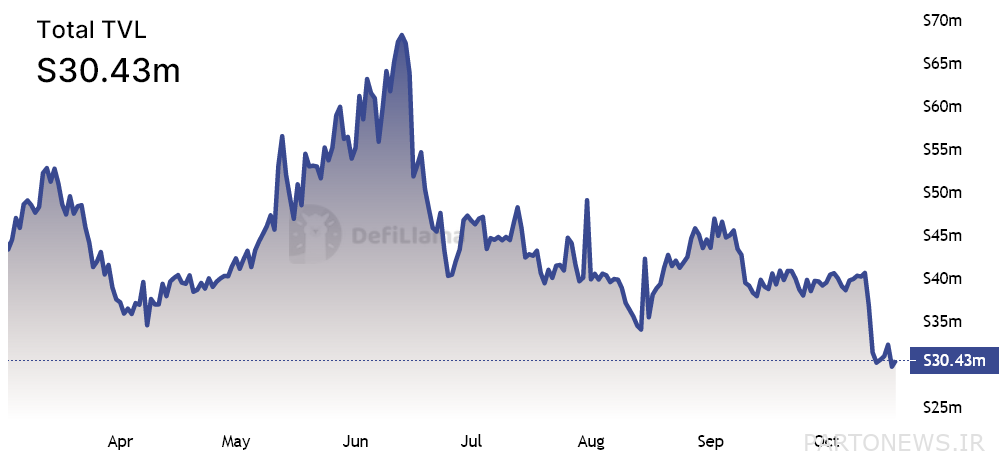
The main indicator of the activity of Solana’s decentralized programs shows signs of decrease before the beginning of November. Solana’s Total Locked Capital (TVL) value, which measures the volume of deposits in smart contracts, reached its lowest level since September 2021 (Sep 1400), 30.4 million Solana.

Of course, there are other factors that affect Solana’s price reduction and the total value of its locked capital. Investors should also check the number of active network addresses to confirm whether the use of decentralized applications has effectively decreased.

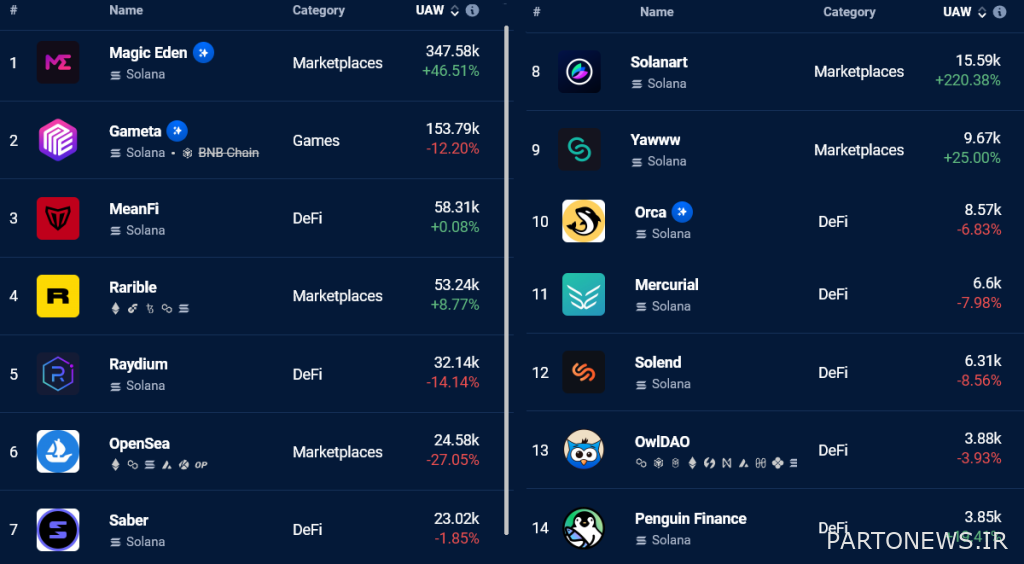
Depredar data on October 19 (27 Mehr) shows that in 13 of Solana’s top 20 decentralized applications, the number of addresses interacting with these applications has decreased. This decline in interest can also be seen in the Solana futures trading market.
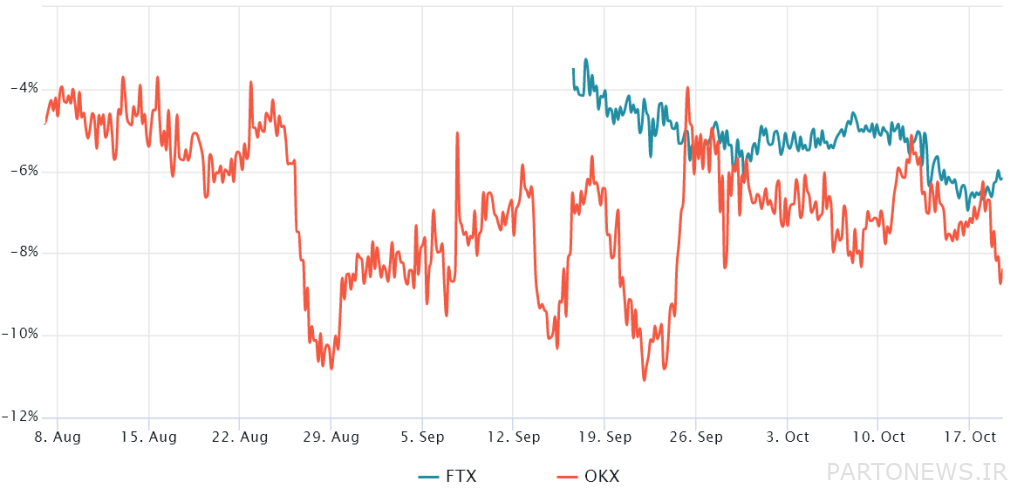
Futures contracts that have a fixed maturity are usually traded with a slightly higher premium than the spot market; Because investors demand more money to avoid settlement. Moving towards zero or becoming negative of this indicator is worrying; because it can be a sign of a downward situation called inversionBackwardation) Is known.

The above chart shows that Solana futures contracts are traded at a 7% discount compared to its current price in the spot market. These data can be alarming; Because they indicate the lack of interest among buyers to use financial leverage.
The price of Solana will continue its downward trend until these indicators change
It is difficult to determine the exact reason for Solana’s price drop; However, it is clear that the issue of centralization, the decrease in the use of decentralized programs and the drop in the interest rate of derivatives transactions have played an important role in this downward trend.
For the bullish trend to begin, investor sentiment must change, there must be an inflow of capital to deposit, and the total value of locked capital and the number of active Solana addresses must increase. As a result, Solana investors shouldn’t expect a price jump any time soon, as the Network Health Check indicators show.

