3 indicators that show that Bitcoin’s 10% jump last day is the end of the downward cycle

The statistics related to the derivative markets and the sudden growth of Bitcoin’s dominance rate indicate the formation of an unprecedented change in the market of this digital currency; But can we say that the coincidence of these changes with Bitcoin’s 10% jump the previous day marks the end of the recent downward cycle?
To Report Cointelegraph, the correlation between the price of Bitcoin and the US stock market has been unusually high since mid-March (Esfand 1400); This means that these two asset classes have had similar price movements and fluctuations during this period. These data may be able to justify ignoring the 10% jump of Bitcoin to above $21,000 among traders the previous day; Especially considering that the stock market index “S&P 500 E-MINI FUTURES” has grown by 4% within two days. However, recent trading activity and derivatives market statistics strongly support recent price growth.
Interestingly, the recent increase in the price of Bitcoin happened a day after the White House Office of Science and Technology Policy released a report on the energy consumption of digital currency networks. In this report, it is recommended to implement reliable standards to increase energy efficiency in this area. In addition, the experts of the White House have suggested to American government organizations to start their relationship and partnership with the digital currency mining industry by providing assistance in technical fields.
As can be seen from the chart above, in many places, price peaks and valleys are formed at the same time. However, this correlation changes depending on investors’ sentiments and assessment of the level of risk in the market. For example, between May and July 2021 (May to July 1400), this correlation was mostly inverse; That is, while the stock market was growing, digital currencies were falling.
The more important point is that a deep gap can be seen between these two charts from mid-July to mid-August this year (July to August) and as it can be seen, the stock market has grown significantly during this period. Comparing the Bitcoin price index and S&P 500 FUTURES with equal scales is a better method; But since the volume of fluctuations of the two are different, the result is not correct. Also keep in mind that these gaps tend to close, according to the history of these two indicators.
The S&P 500 FUTURES index has fallen by 18% from the beginning of 2022 to September 6 (15 September), and Bitcoin has lost 60.5% of its value in the same period of time. Therefore, naturally, if investors’ desire to trade risky assets increases, those risky assets that experience more price fluctuations will perform better.
Apart from this issue, other factors also affect market volatility and therefore there is no way to accurately predict the path of prices. However, the increased willingness of market participants to invest in risky assets can justify the better performance of Bitcoin compared to the stock market and significantly reduce the gap between the two indices.
Professional traders did not expect Bitcoin’s jump yesterday
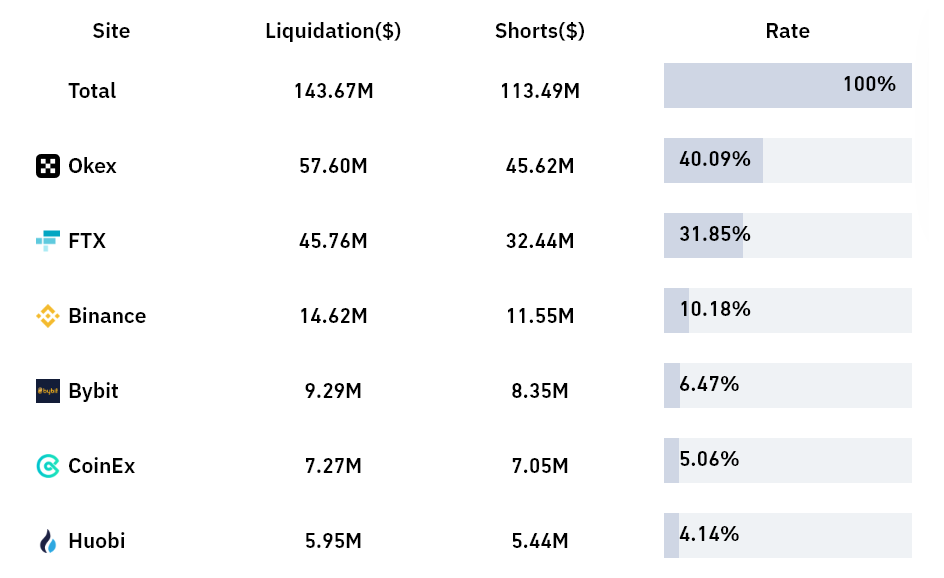
Last day, $120 million of short trading positions (selling or profiting to reduce the price) were liquidated in the Bitcoin market, which is the highest record since June 13 (June 23). Obviously, due to the fact that Bitcoin has decreased in price by 13% during the two weeks ending on September 7 (16 September), no one expected such a jump from this digital currency; But one can guess how surprised the short traders were after their positions were liquidated.
In addition, other evidence can be extracted from the data related to the liquidation of traders in different exchanges.

For example, derivatives exchanges Binance and Bybit, in which retail traders are active, accounted for 17% of liquidated trading positions; While the share of these two exchanges in the Bitcoin futures market is about 30%. These statistics leave no doubt that the big whales active in the futures market of the exchange “OKX” and “FTX” are among these liquidated traders.
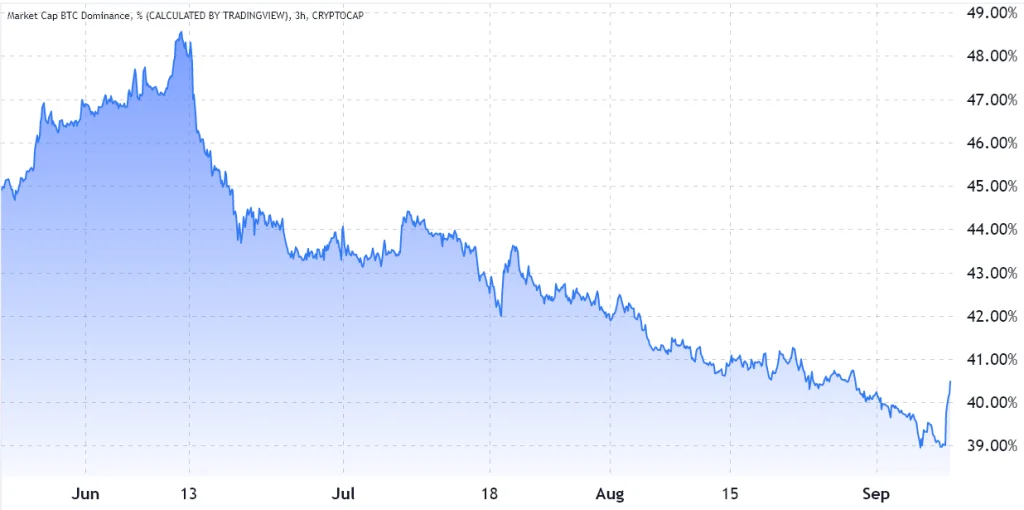
Another statistic that distinguishes the 10% jump of Bitcoin yesterday is the dominance rate of Bitcoin; An index that compares the market value of this digital currency with other digital currencies.

As can be seen from the chart above, the dominance rate of Bitcoin has jumped from 39% to over 40.5%; A move similar to that (in terms of jump) has not been seen since May 11, when the price of Bitcoin fell below $26,000. It then took 31 days to break the $28,500 support on June 12.
Note that Bitcoin dominance rate increases can occur both during bullish spikes and at the same time as deep bearish price corrections, so using this indicator alone will not help traders interpret the market much.
The fear of ruling on options markets is disappearing
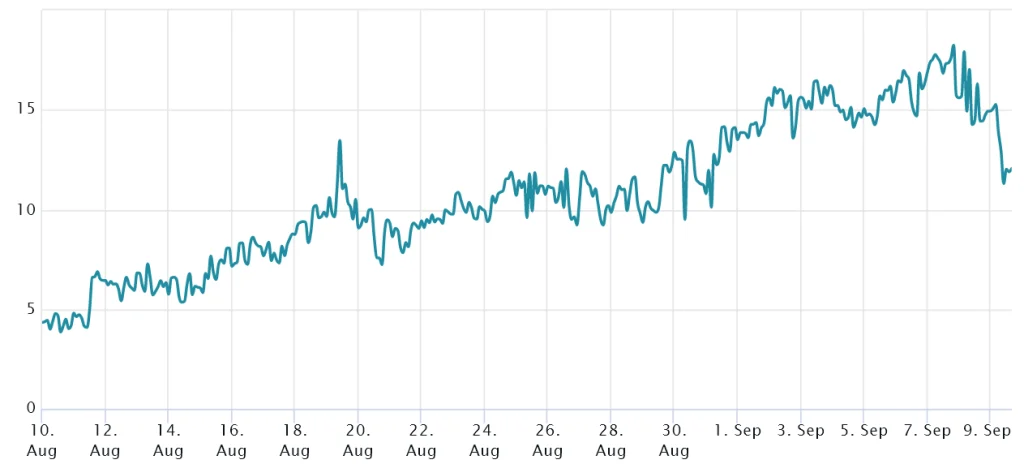
The 25% Delta Skew, which is a measure of fear and greed in Bitcoin option markets, has now improved so much that it can be said that it is on the verge of moving from the fear zone to the neutral zone.

If the traders of Bitcoin option contracts are worried about the price falling, this index will reach above 12%, and on the other hand, if these traders are excited about the price increase in the future, this index will change its position below negative 12%.
After reaching a peak of 18% on September 7, Bitcoin’s 25% delta deviation index is now at the 12% level, which is considered the border between the neutral and bearish range. In addition, Friday’s jump in Bitcoin suggests that professional options traders are no longer asking high prices for Bitcoin Put Option contracts.
Together, these three indicators justify the 10% jump of Bitcoin last day. The $120 million in liquidated short positions over the past day mostly occurred on exchanges with fewer small traders, the 1.5% growth in Bitcoin dominance and the bullish outlook among options traders all suggest that Bitcoin may finally be bottoming out. It has reached itself.

