3 reasons to jump Bitcoin to $ 60,000 again

Despite the downturn in the market, the continuing political controversy and the recent volatile trend of bitcoin, there is still the possibility that the digital currency will jump back to $ 60,000. Analysts have cited three reasons for this that they think will make the digital currency market rise again.
To Report The Bitcoin Telegraph’s Bitcoin price fell below $ 38,000 in March, losing all the peaks it reached last week at $ 45,000.
Brent crude rose 18 percent early in the day to about $ 139 a barrel, the highest level since 2008. Major sales in risky markets and falling prices seem to be mainly due to rising crude oil prices.
However, when Bitcoin failed to mitigate the risk of market fluctuations for its holders, some investors were skeptical of using it as a “value-saving tool.” Meanwhile, on Monday, the correlation coefficient of Bitcoin with the Nasdaq Composite Index, the index of 4,000 US and non-US stocks on the Nasdaq Stock Exchange, reached 87%.
In contrast, Bitcoin’s correlation with gold, its main competitor, fell to a negative 38%, indicating that they performed quite differently during the market turmoil.
On the other hand, despite the escalation of the conflict between Russia and Ukraine and the possibility of an increase in bank interest rates in the United States in March, it is likely that bitcoin will continue to decline.
However, some technical and intra-chain indicators in the shorter period indicate an uptrend and a possible return of the price to $ 60,000 in the coming months.
Bitcoin multi-year uptrend line support
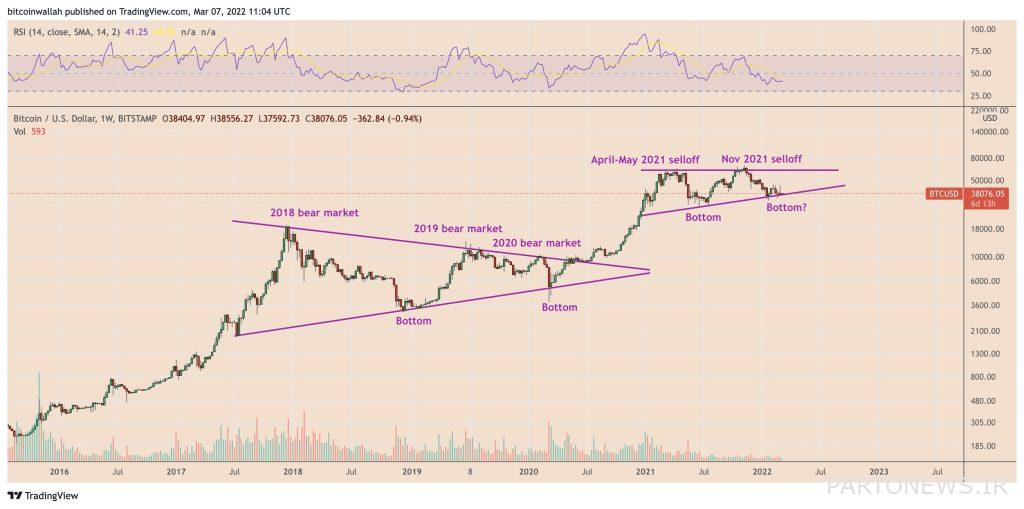
If history repeats itself, the recent decline of bitcoin to the level of support of its multi-year uptrend line could pave the way for a possible return to the $ 60,000 resistance.

It should be noted that the trend line consisting of Bitcoin support points and the trend line consisting of its horizontal resistance points has created an ascending triangle pattern. This situation has been going on since December 2020. The floor of the model serves as an accumulation area and the ceiling acts as a sales area for traders.
The number of bitcoin whales is increasing
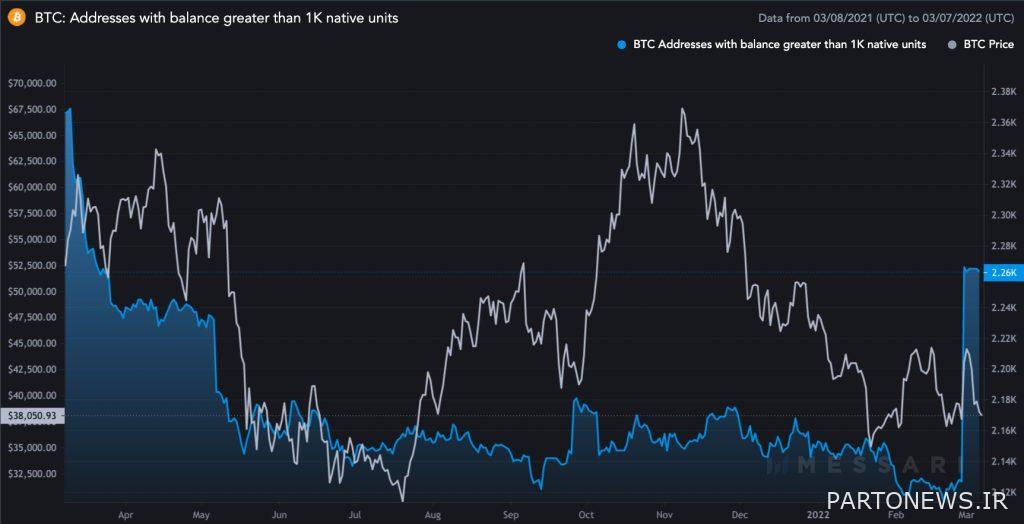
On the other hand, data from the CoinMetrics chain shows that wealthy investors are buying bitcoins at the same current price levels.
For example, the number of addresses with at least 1,000 bitcoins (whales) grew exponentially between February 27 and 28, from 2,177 to 2,266.

During the same period, the price of bitcoin rose from about $ 38,000 to about $ 45,000. On March 6, the price of Bitcoin fell below $ 38,000; But only three of these whales sold their bitcoins and were removed from the list of addresses with at least a thousand inventories. This shows that rich people have decided to keep their capital despite the temporary negative feelings that exist in the market.
Johal Miles, an independent market analyst and investor, also notes that many investors accumulate more bitcoins when the price is in the range of $ 33,000 to $ 38,000. As a result, it will be difficult for sellers to break the support of this range.
The process of withdrawing bitcoins from exchange offices has remained constant
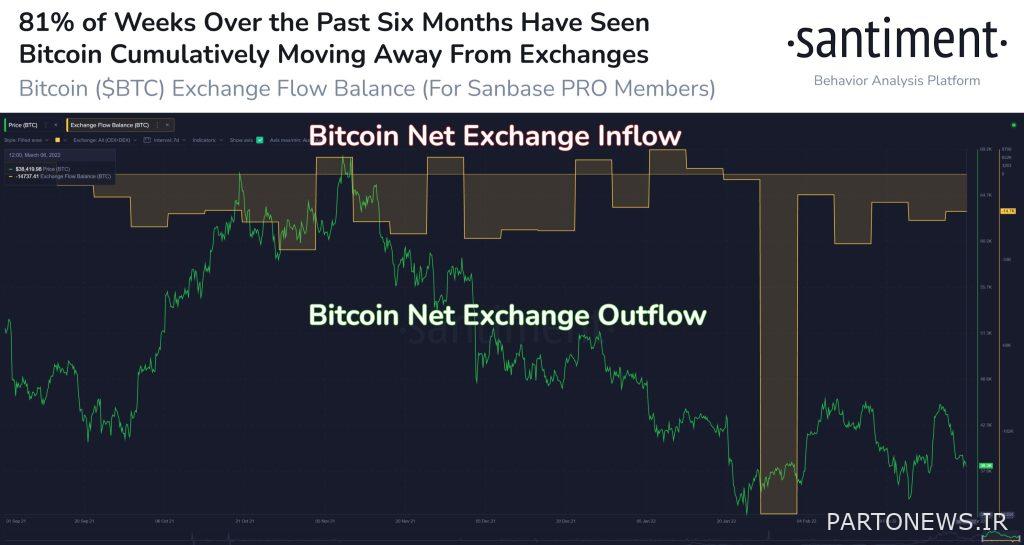
Data from Santiment, the Digital Currency Analysis Service, show that since October 2021 (October), 81% of the net weekly flow of bitcoin inflows and outflows from exchanges has been negative. In other words, during this period, the volume of bitcoins that left the exchanges is more than the volume of bitcoins that entered them. The bitcoin price approaching its six-month low has not changed anything.
In his tweet on March 7, Santiment wrote, citing the flow chart of bitcoin inflows and outflows in exchange offices (photo below):
Bitcoin withdrawals from exchanges in the last 21 weeks out of the last 26 weeks have been higher than the flow in accounts in exchanges.

Increasing the outflow of bitcoin exchanges shows that investors are looking to hold on to bitcoin for the long term. Conversely, the increase in bitcoin inflows of exchanges indicates that investors intend to exchange their bitcoins for other digital assets or fiat currencies.

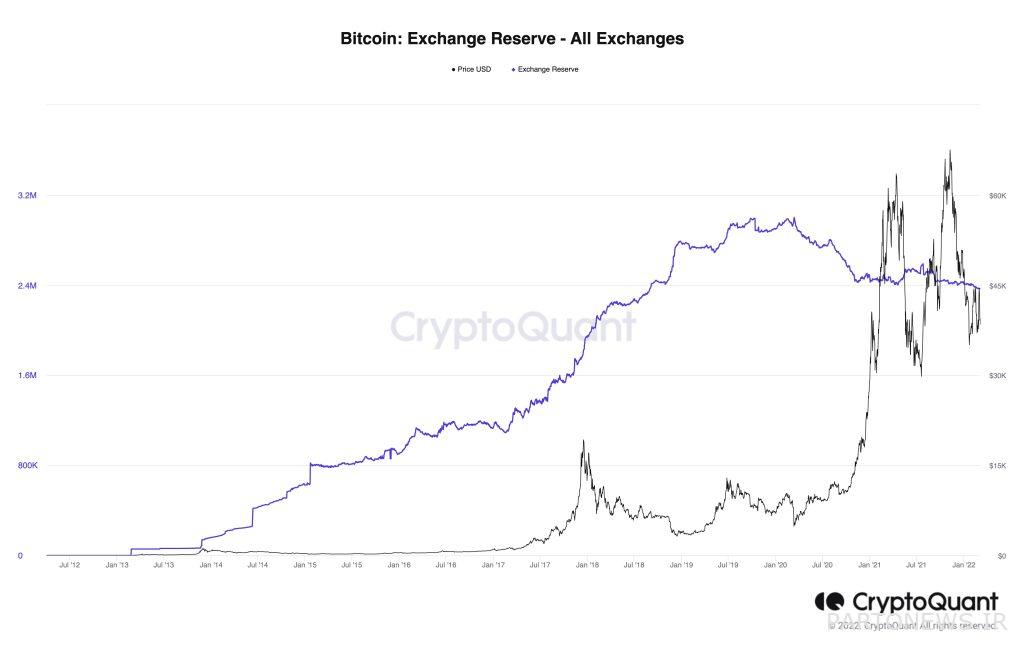
According to CryptoQuant, the stock of digital currency exchanges is still declining. Bitcoin exchanges’ holdings have now reached their lowest level since September 2018 (September 97), ie 2.4 million bitcoins.

