3 reasons why the price of Bitcoin has not reached the bottom yet

The Bitcoin price candle has been on the rise in the last two days; However, the value of this digital currency has decreased by 13.7% over the past week, which is its worst weekly performance since mid-June. Examining some such indicators shows that the Bitcoin correction period is over. However, considering these indicators alone can mislead many investors.
To Report Cointelegraph, index Hash Ribbons, one of these indicators is such. A metric that examines the Bitcoin hash rate to determine periods of accumulation or crowdsale of miners. Examining the recent changes of this index shows that the stage of mass sale of miners has ended on August 20 (29 August). This can lead to a change in the price trend and the upward movement of Bitcoin.
However, one cannot ignore the large number of negative indicators that indicate the bearishness of the overall Bitcoin trend; From negative technical analysis to risks and problems caused by the macroeconomic situation. As a result, despite such optimistic criteria, the possibility of starting a downward trend cannot be ignored. In the rest of this article, citing 3 reasons, we will say why Bitcoin has not yet reached its price floor.
Bitcoin price in a bullish corner pattern
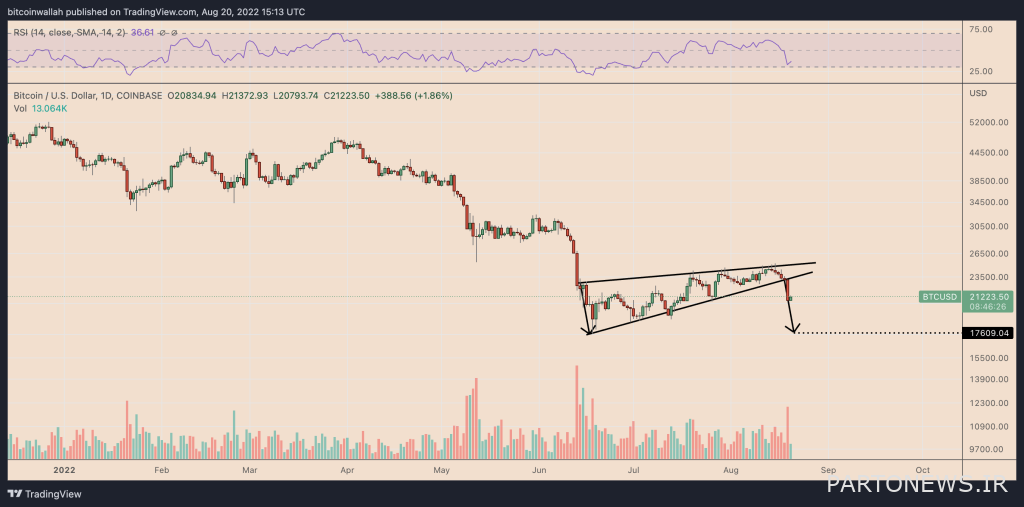
The decrease in the price of Bitcoin in the last week has created a rising wedge pattern on the one-day chart. With this pattern forming, we are likely to see it fall further in the coming weeks. A bullish angle is a bearish reversal pattern that forms at the end of an uptrend with a steeper support line than resistance. In this pattern, the price breaking downwards can lead to a price decrease to the maximum height between the ceiling and floor of the corner formed.

The technical chart above shows that if this pattern is to be completed by reaching its price target, Bitcoin could fall to $17,600. In other words, the price of Bitcoin will probably decrease by 25% from the current levels by September.
Read more: Getting to know 10 technical analysis chart patterns that every trader should know
Buyers’ incorrect analysis of Fed decisions
After reaching its price floor of $17,500 in June, Bitcoin has increased in price by nearly 45% during the formation of the bullish corner pattern on the chart. Interestingly, the start of Bitcoin’s upward trend has been accompanied by the growing expectation of investors from the peak of the inflation rate and the first reduction of the bank interest rate in March 2023 (Esfand 1401) by the Federal Reserve.
These expectations were created when Jerome Powell, the chairman of the Federal Reserve, published the statement of the “Open Market Committee” of the Central Bank of America on July 27 (August 5).
Powell said in this statement:
The tightening of accommodative monetary policy continues, and we are likely to reduce the pace of rate hikes going forward as we assess the impact of our overall policy adjustments on the economy and inflation.
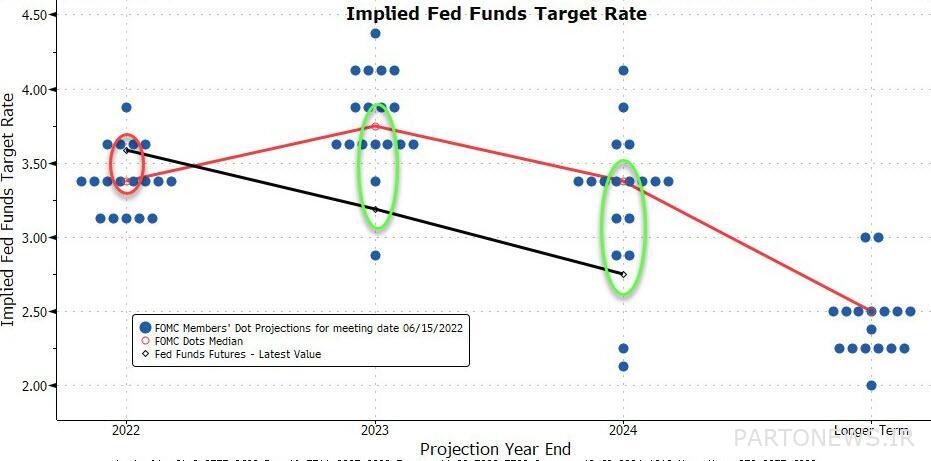
A review of the latest dot chart of the Federal Reserve’s “target funds rate,” the rate at which depository institutions and banks make unsecured loans to other institutions, shows that most officials expect the rate to fall to 3.75 percent by the end of 2023 and 3.75 percent in 2024. to decrease by 4%. Therefore, the prospect of interest rate cuts in the future remains speculative.

James Bullard, head of the Federal Reserve’s office in St. Louis, has said he will support a third consecutive 0.75 percentage point increase in interest rates at the central bank’s September policy meeting. According to its commitment, the Federal Reserve is supposed to reduce the inflation rate from the current level of 8.5% to 2%.
In other words, with the beginning of the contraction cycle of the Federal Reserve in March (March 1400), Bitcoin and other risky assets of the market were also in a downward trend and should remain under this pressure for the next few years.
Historical cycles repeat themselves
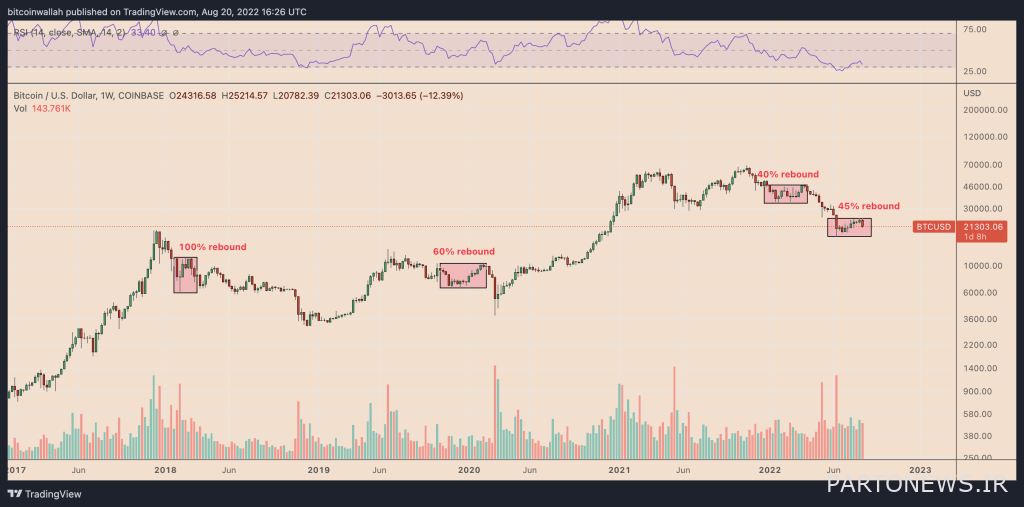
If we look at Bitcoin’s previous bounces in bear markets, its price rally and relative recovery in recent weeks could be mistaken for a bullish signal.

During the bear cycle of 2018, the price of Bitcoin almost doubled at one point, from around $6,000 to over $11,500; But then it fell again to $3,200, wiping out investors’ profits. These growth cycles and price corrections have also occurred in 2019 and 2022.
Read more: market cycle; Everything you need to know about market phases

