5 key metrics by which you can identify the end of the bitcoin downtrend

It is almost impossible to predict the market floor of digital currencies; But traders can guess the end of the downtrend using several important and practical indicators.
The bullish market for digital currencies is over, and the fact that the long winter of digital currencies has begun has certainly frightened traders. The price of Bitcoin has dropped so much that even sellers did not expect it. Some investors may now be wondering how Bitcoin wants to make up for this decline.
The price of digital currencies is falling every day, and the question that is on everyone’s mind is when the downturn will end and how long it will continue. It is impossible to predict exactly when the downtrend will end, but by studying previous downtrends, one can see signs of the end of this downtrend.
Based on that an article According to the Coin Telegraph website, we intend to examine five indicators that can be used to estimate the end of the winter of bitcoins and digital currencies.
The process of hiring and adjusting staff in companies active in the digital currency industry
One of the classic signs of the winter of digital currencies is the massive layoffs of companies operating in the industry. This is because companies are trying to reduce their costs so that they can survive in this sluggish period.
In 2018 and 2019, there was a lot of news about the dismissal of employees in companies in the digital currency industry. Some of the big companies in the industry that did so at the time were institutions such as ConsenSys and Bitmain, as well as exchanges such as Huobi and Coinfloor.
Recent layoffs in the digital currency industry, including a 19 percent drop in Coinbase staff and a 10 percent drop in Gemini staff, are worrisome; But given that the current downturn in the market has just begun, it is likely that this trend has not yet peaked. In other words, we may not be able to cite this criterion at this time as evidence that the downtrend is nearing completion.
One of the signs of an improvement in the digital currency market is that companies are starting to hire again and new projects are being launched with significant budgets. These factors indicate that capital has returned to the market and the most difficult days of the downturn are over.
Check the position of the simple 200-week moving average of bitcoins
The technical factor that has repeatedly signaled the end of Bitcoin’s downturn has been that the price of Bitcoin first fell below its 200-week moving average (SMA200) and then climbed above it again.
As you can see in the areas marked with purple arrows in the chart above, in the past, whenever the price of Bitcoin fell below its 200-week moving average (light blue line) and then returned above it, the uptrend began.
If the price of Bitcoin exceeds the realized price (green line), it is confirmed that the market trend is likely to continue to be positive. It should be noted that the realized price indicates the purchase price of all circulating bitcoins.
Look at the position of the relative power index
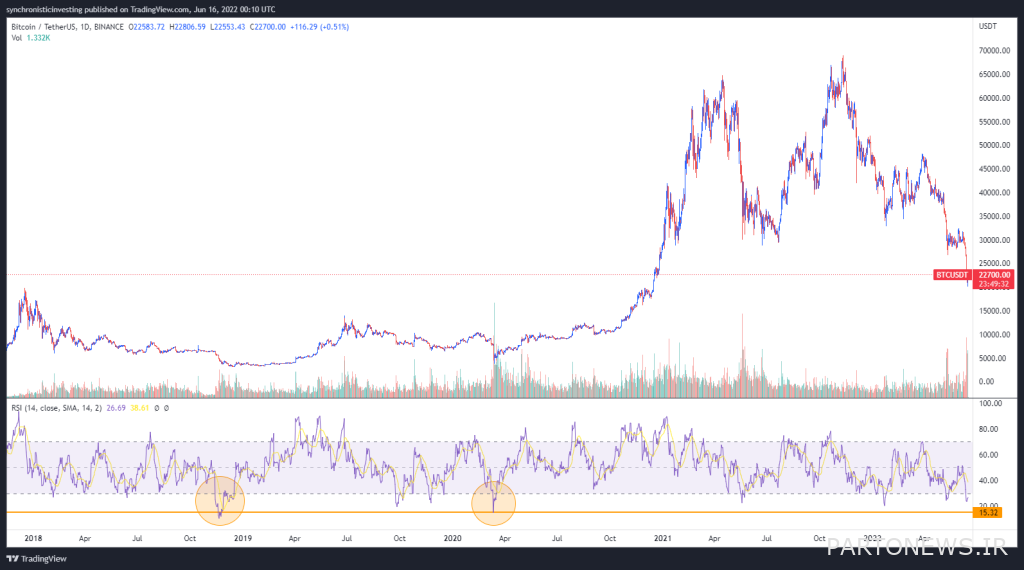
The Relative Strength Index (RSI) is another technical indicator that can indicate when the downtrend will reach its peak.
In previous downtrends, the Bitcoin RSI first traded in the saturation zone and then fell below the 16 level as the digital currency plummeted.

Based on the two orange areas in the chart above, it can not be said with certainty that bitcoin is at its bottom until the RSI reaches above the 70 level and the buy saturation range. A return to above level 70 confirms that buyer demand has increased again.
The ratio of market value to realized market value
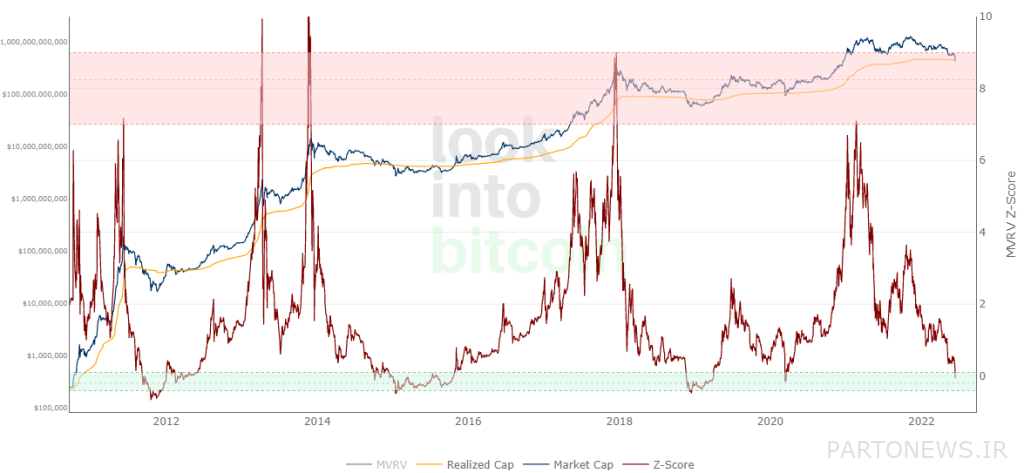
The MVRV Z-Score compares the market value of a digital currency with its realized market value and shows that the price of this currency is more or less than its fair value.

In the chart above, the blue wave indicates the current value of the bitcoin market, the orange line indicates the realized price, and the red line indicates the Z rating. The Z-score is a deviation from the standard that indicates the gap between the market value digit and the realized value.
As you can see in the chart, in the previous downtrend markets, the Z-score fell below the level of 0.1 (green box at the bottom of the chart) and the start of the bitcoin uptrend was confirmed only when the index climbed above the range of 0.1 .
Based on the performance of this index in the past, it can be said that the bitcoin trend continues to decline in the short term and then enters a neutral market for the long term.
Biennial moving average coefficient
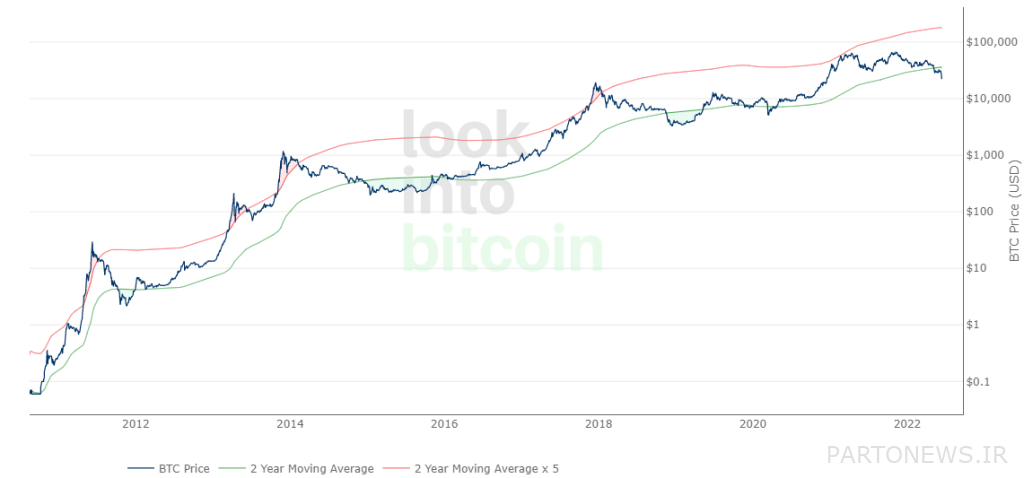
The last indicator that can show bitcoin investors when the market downtrend is over is its two-year moving average. This index examines the moving average of bitcoin over the past two years and the 5-fold coefficient of the two-year moving average of bitcoin with price.

Whenever the price of Bitcoin falls below the two-year moving average, it enters a bearish zone. On the other hand, when the price of Bitcoin rises above the 2-year moving average, the uptrend will resume.
At the same time, the rise of the price above the factor of 5 times its two-year moving average indicates a full bullish market and a suitable time to save profit.
Traders can use this indicator (green line) as a signal for accumulation. In addition, they can wait for the price of Bitcoin to cross its two-year moving average and signal the end of a bearish market.
It does not matter which index you use; You just have to remember that no index is perfect and there is always the risk of further decline in the price of digital currencies.

