800% growth of BOND token in the last month; How far does the upward trend continue?

The news of the 800% growth of a new token in the current market conditions can encourage many traders and investors to buy it; But can buying a bond token (BOND) be a good option to compensate for the loss of a trader’s previous investments? In the following, we will briefly review the BarnBridge protocol and predict its possible price in the future.
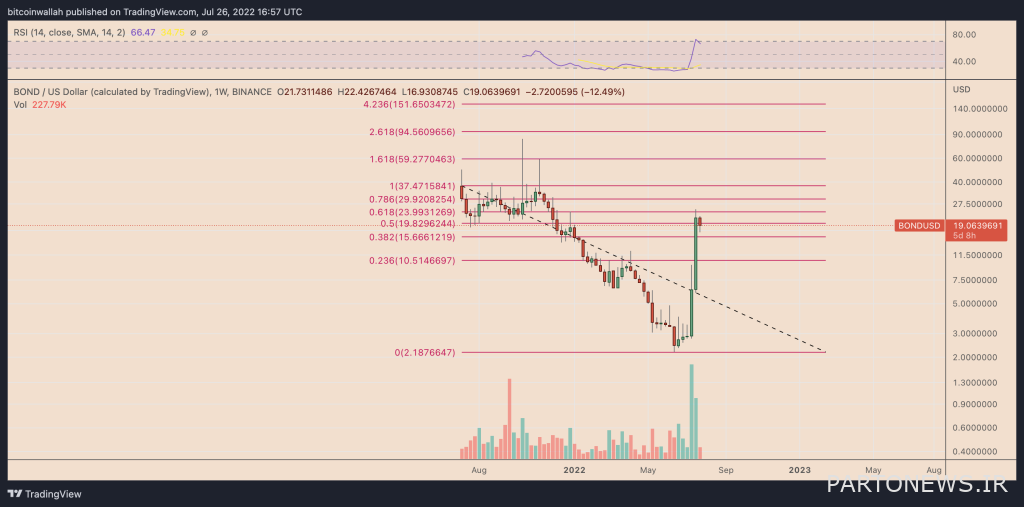
To Report Cointelegraph, the price of a new and relatively unknown DeFi token called Barn Bridge has recently increased by more than 800%, reaching $20 on July 26. Bond token price growth occurs in more than a month and after its price decrease to around $2.19. Compared to this DeFi token, Bitcoin and Ethereum have decreased by 0.5% and increased by 18%, respectively, in the same period.
Is Barn Bridge Another Pump and Dump Scheme?
Barn Bridge is a cross-chain investment risk management protocol that offers investors a set of combinable DeFi products. Investors actually use these instruments to hedge the risk of their portfolio against irregular changes in interest rates and price fluctuations.
Some of the products of this protocol, such as SMART Yield, allow investors to obtain the yield of collateral pools of other projects such as Yearn.finance, Aave, Compound and Cream Finance at a rate Guarantee fixed. There is another product called SMART Exposure in this collection, which offers investors tools to rebalance their portfolio.
Barn Bridge’s latest product, which is called SMART Alpha, provides investors with the possibility of hedging against price fluctuations and provides them with trading leverage in uptrends. In the meantime, Bond digital currency also serves as an Ethereum network-based governance token for the Barren Bridge protocol’s DAO.
It seems that the latest surge in the price of Bond token reflects the growing interest in investing in protocols that can help users hedge the risks of investing in the digital currency market; Especially now that most projects in the field of DeFi have failed. However, if one were to look closely at the band’s trading volume, one would conclude that much of this 800% growth was due to opportunism by short-term investors.
According to the data of the Coin Market Cap website, more than 50% of the trade volume of Bond token in the last 24 hours (August 4) was related to the Binance exchange. However, as the image below shows, the daily trading activity of the BOND/USD currency pair has decreased during the price jump.

The divergence between price and volume indicates that fewer investors have been behind the price growth of Bond Token, which increases the chances of a sharp price correction in the coming days or weeks.
Forecasting the future price of Bond Token
Drawing Fibonacci retracement levels from the band’s high of $37.5 to its low of $2.18 on the weekly chart identifies potential support and resistance levels.

As can be seen from the image above, the price of Bond digital currency has declined after testing the $24 level as temporary resistance. The token is now predicted to move towards $15.6 with a long price correction; This means a 17.5 percent decrease compared to its price on July 26 (August 4).
Also read: technical analysis training; Elliott waves and Fibonacci levels
On the other hand, the level of $30 can be the next target of Bond token if the price rises and crosses the $24 range. If this resistance is broken, $37.5 will be the next price target, which is 95% higher than the current price of this DiFi token.

