An important indicator shows that the downward trend of Bitcoin is over; Analysts: Market forecasting has become more complicated than ever

Bitcoin has recently reached its highest price in the last 6 weeks and an important and historically accurate indicator predicts the end of the downward trend of this digital currency; But is it possible to hope for the beginning of the upward trend of Bitcoin by considering only these two signs?
To Report Cointelegraph, Bitcoin is experiencing what some analysts call a “bearish intra-market bounce”. Although the price of this digital currency increased by more than 20% in July, numerous fluctuations continue to confuse analysts.
Approaching the end of July (August 9), the index Puell Multiple It has broken out of its lower zone, creating hope that the main part of the Bitcoin price downtrend may be over.
An upward sign in one of such important indicators
The Poel index is one of the most well-known measures in Bitcoin on-chain analysis. This index measures the value of bitcoins mined on a given day compared to the average value of bitcoins mined over the past 365 days.
This obtained index is used to determine whether the amount of coins mined in one day is more or less than the average of the last year. Also, examining this index can provide traders with an understanding of the profitability of mining and a general understanding of oversold conditions in the market.
After reaching the range that is mainly associated with the formation of the Bitcoin price floor, the Poel index is now targeting higher levels. Normally, this can be a sign of the beginning of an uptrend.
Grizzly, one of the authors of the CryptoQuant analysis platform, wrote on July 25 (August 3) in the Quicktake market analysis section of the platform:
Historical data shows the exit [مضرب پوئل] From this area, it has always been associated with the formation of an upward movement on the price chart.
The Poel index is not the only sign of the beginning of an upward trend in the current situation, and the accumulation trend of holders also indicates that the price has reached its long-term bottom.
Also read: What is On Chain Analysis?
Unprecedented conditions in the world economy
After an unexpected surge in value in the second half of this month, Bitcoin has now reached its highest price level in the last 6 weeks and is far from its new price low. The departure of traders’ feelings from the “fear” zone has also caused market analysts to point to a unique phenomenon that makes it very difficult to definitively predict the changes in the price trend in the bearish market of 2022.
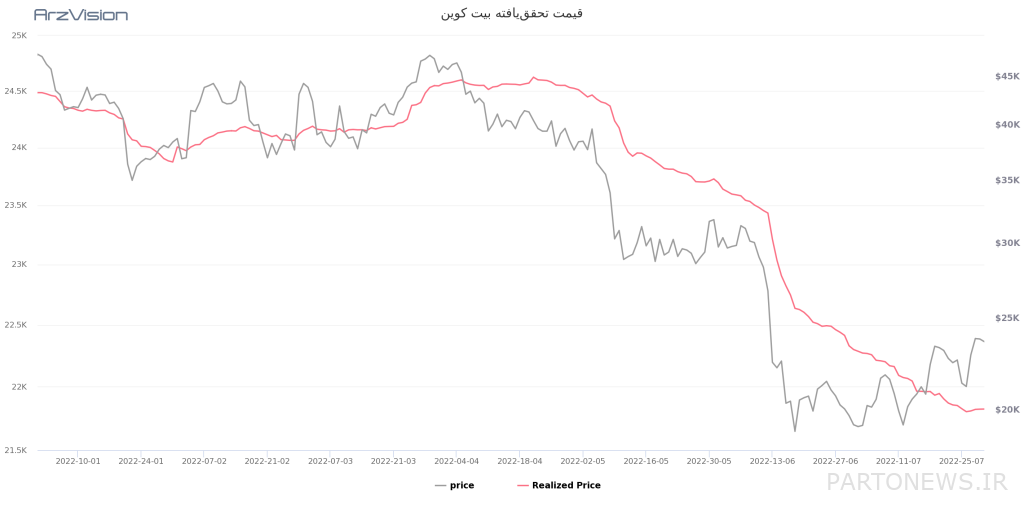
Another analysis of the QuickTick cryptocurrency section points out that even the price trend lines are not functioning normally in this situation. In particular, Bitcoin in recent weeks several times the level Realized Price It has cut itself off, something that has never happened before in bear markets.
The realized price of Bitcoin is actually something like the average purchase price of network addresses, calculated based on the spot price of the last transfer of each unit, and is currently less than $22,000. As CryptoQuant explains, in previous market cycles, the realized price has been used as a tool to spot a price floor.
Importantly, the price of Bitcoin did not cross the realized price threshold in the last two periods (134 days in 2018 and 7 days in 2020). However, the price has crossed this level three times since June 13 (June 23), which indicates the uniqueness of this cycle (Bitcoin price) due to unprecedented macroeconomic conditions.

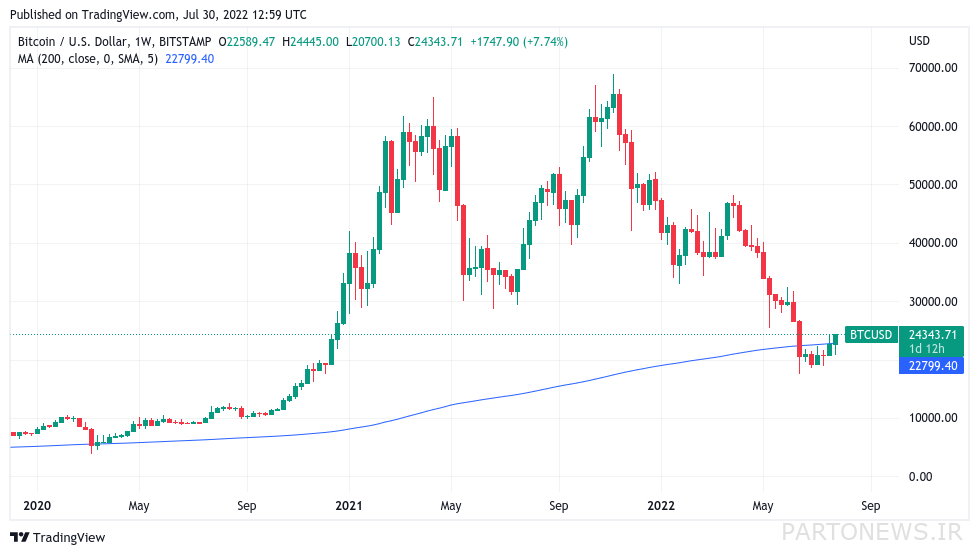
These conditions have shown themselves in the form of the highest inflation rate in the last 40 years in the United States, the excessive increase of bank interest rates by the Federal Reserve and signs of the American economy entering recession. At the same time, in addition to the realized price, Bitcoin price has developed an unusual relationship with its 200-week moving average (MA 200) in this bear market.
While the 200-week moving average has served as a support range for Bitcoin in the past, the price was able to turn the 200-week moving average into a new resistance for the first time in 2022. It should be noted that this moving average is now at the level of $22,796.


