An uptrend can push the price up to $ 10,000

The weekly Atrium / Dollar Market Overview shows a classic pattern that, if done correctly, could push the Atrium price to $ 10,000. But what is the probability of achieving the goal of this model?
To Report Kevin Telegraph There is an upward triangle pattern in the weekly Atrium / Dollar market view. The uptrend triangle, as its name implies, is a continuous pattern that appears during uptrends. Analysts confirm the emergence of this pattern on the chart when the price fluctuates in the range of a right-angled triangle, and with this move near the bottom trend line of the pattern, a series of ascending floors and a resistance at the top of the pattern. As this pattern progresses, trading volume usually decreases.
At present, a similar uptrend can be seen in the weekly view of the Atrium market, the lower trend line of which has acted as a range for buyers since early 2021, and as can be seen in the chart below, the upper trend line has been the resistance area. As it approaches, sales pressure has also increased.
This pattern basically appears before a significant price jump, and the size of this jump should be something equal to the maximum distance between the top and bottom trend lines of the pattern; That is, after the resistance of the pattern is broken, the price is likely to rise so much.
If Atrium continues to work correctly and everything goes according to the calculations on the chart, Atrium’s price could cross the $ 10,000 level. In longer-term market views, however, another technical pattern predicts a $ 4,000 price target for Atrium.
Also read: Familiarity with 10 Technical Analysis Chart Patterns That Every Trader Should Know
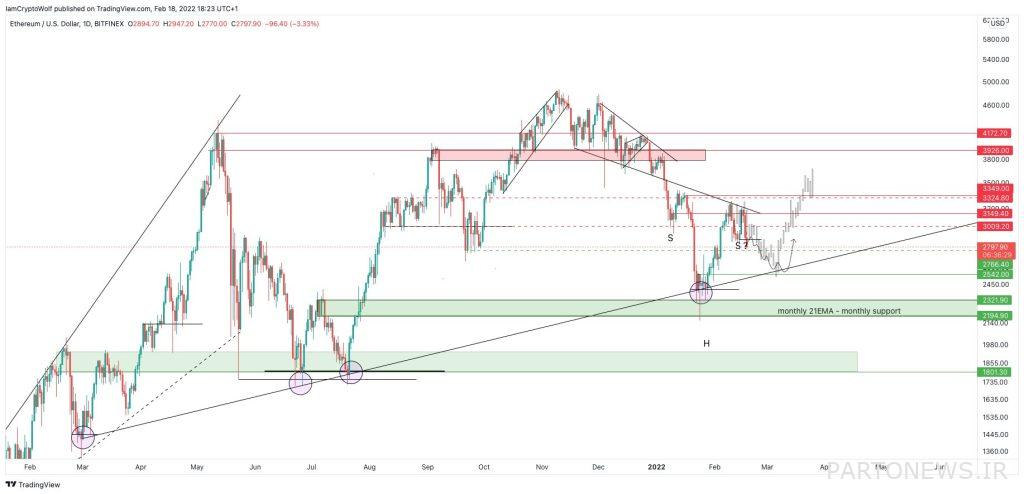
An analyst on Twitter, Wolf, expects the Atrium market to continue to rise again. He attributed the uptrend to the possible bullish pattern in the one-day market.

Are the recent price fluctuations of a cow trap?
The bullish triangle pattern emerged when Atrium was able to prevent further price declines after falling to $ 2.50 in January. Atrium prices then rose more than 25 percent in less than four weeks.
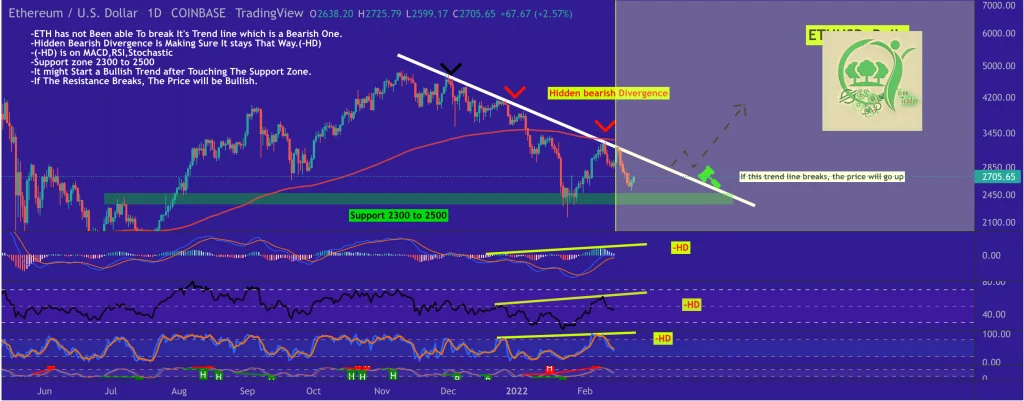
On the other hand, some analysts see the recent atrium recovery process as a trap; That is, the situation develops in such a way that it may confuse traders in relation to the price trend and cause them to suffer unexpected losses by liquidating trading positions. One of these pessimistic analysts is called “TheTreeTrader”, which publishes its analysis on the Trading View platform.
Regardless of the bullish triangle pattern on the Atrium chart, the analyst has focused on the downtrend line that has emerged as a resistance in the one-day view of the Bitcoin market since November 2021.
Although the Atrium is currently fluctuating below this trend line, momentum indicators, especially the Relative Strength Index (RSI), the MACD and the Stochastic RSI, have been bullish over this period. Momentum indicators are tools that directly track the rise and fall of prices.

As a result, it can be said that there is a downward divergence between momentum indicators and atrium prices; This is usually accompanied by a reversal of the price direction. TheTreeTrader says that if that happens, the price of Atrium could drop to $ 2,300. On the other hand, the crossing and closing of the price candle above the downtrend line can increase the overall trend of the Atrium market.
Traders are concerned about the possible formation of a bull trap, as upward patterns have been seen in the past; But the price has not yet experienced an upward failure.
Earlier in October 2021, Atrium set a similar uptrend with a target of $ 6,500. With Atrium falling to $ 2,100 in recent weeks, the credibility of this pattern seen in the daily view has waned.
Also read: What is a Bull Trap?
What is the status of the Atrium network?
Despite the differing views on the status of the Atrium price chart, the conditions of the indicators related to the Atrium network are promising.
For example, during 2021, about 18.36 million new addresses were added to the network, which means that 1.53 million new Atrium wallets are created every month, and new users have joined the network.

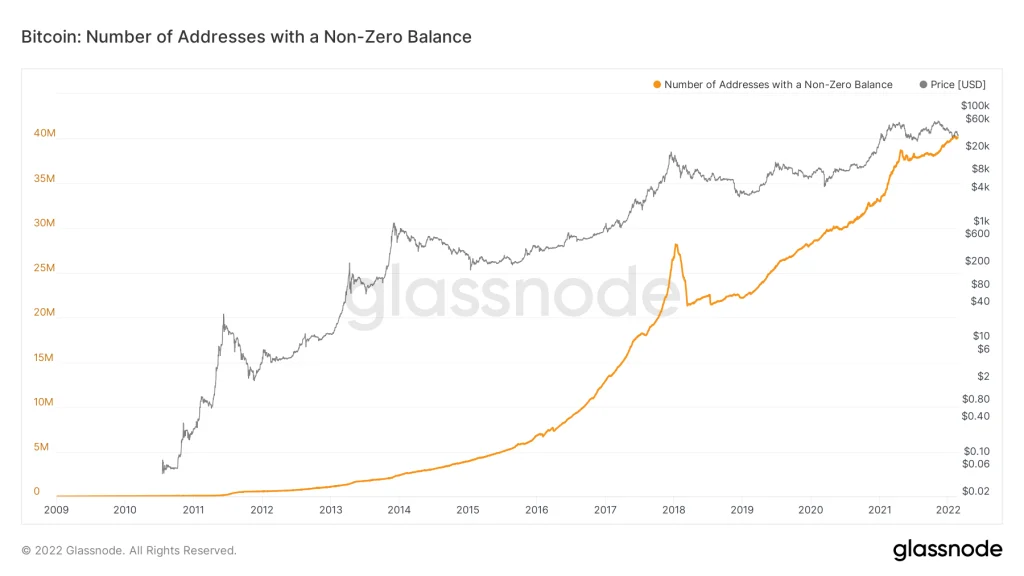
Data from the Gelsnod analytical platform shows that the number of addresses containing at least one atrium reached its highest level in history on February 9 (February 20), at 1.42 million.
In addition, the number of addresses with inventory and wallets containing at least 0.1 Atrium reached a new record of 75 million and 7 million on February 15 (February 26), respectively.

