Anchin’s analysis: Is $20,000 the new floor of Bitcoin?

Bitcoin price support may be purely psychological for some traders. However, the creation of a support zone by several strong indicators seems to have kept the Bitcoin price above $20,000 for the past week. In other words, the on-chain data shows that Bitcoin is probably forming a new price floor in this range.
To Report Cointelegraph, the price of Bitcoin reached the highest level of $20,961 last week. However, this small bounce failed to continue its upward growth and cross the $21,000 resistance. Taking into account this upward jump and the return of the price, Glassnode has checked in its latest report whether Bitcoin is forming a new price floor or not.
Distribution of the realized price of Bitcoin
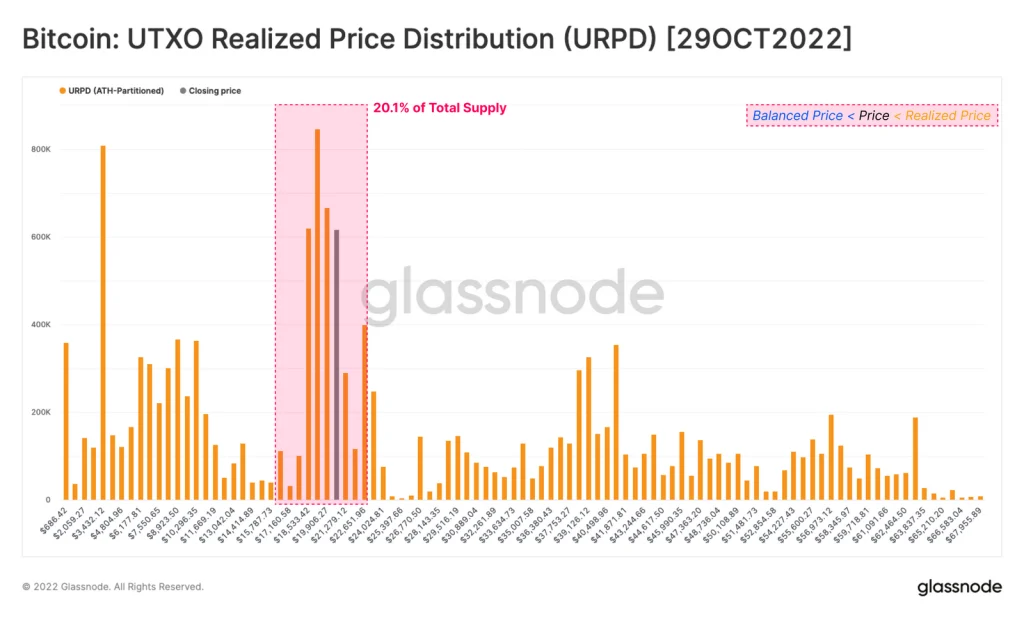
The realized price of Bitcoin represents the average cost that buyers have paid to purchase the Bitcoins they own. Technically, if the price of Bitcoin is lower than the investors’ realized price, they are facing an unrealized loss. The UTXO Realized Price distribution chart of the unspent output of transactions (UTXO Realized Price – chart below) shows the amount of Bitcoin supply distributed in the price of various purchases.
Read more: What is realized and unrealized profit and loss?
During the bear market of 2019, 30% of the total Bitcoin supply was within the realized price range. In April 2019 (April 2019), the price of Bitcoin increased compared to the realized price, which indicated the beginning of a new uptrend in the market.
If we look at the current market with such an approach, 20% of the Bitcoin supply with a purchase price of $17,000 to $22,000 is in the realized price range. Although this number suggests that the start of a new trend is likely to require further redistribution, the significant price consolidation points to the formation of a flexible support level.

When will the bullish breakout happen?
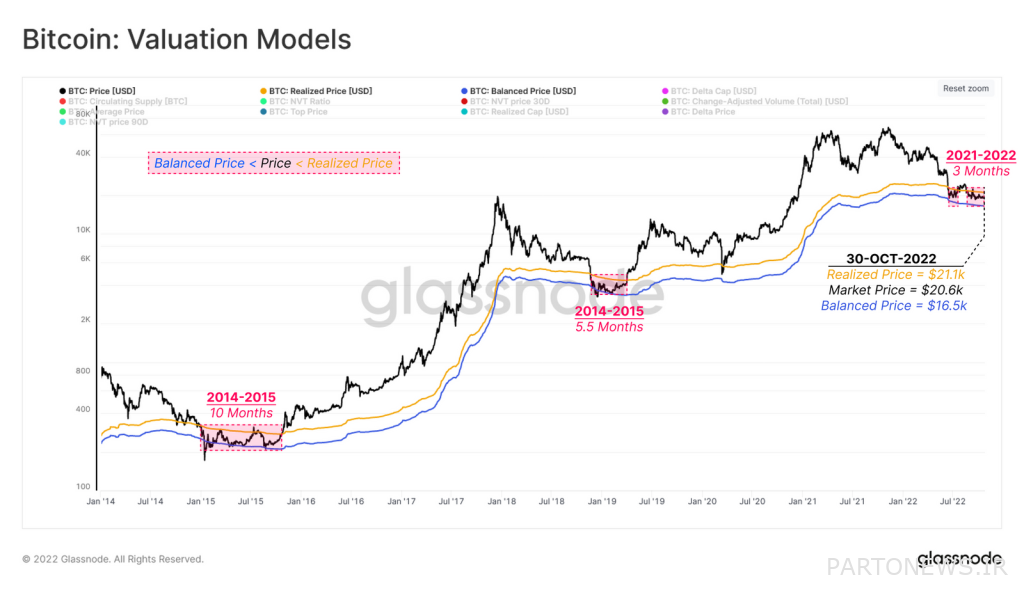
The Bitcoin valuation model will probably show when the price breakout will occur; Like April 2019. Based on historical data, in past cycles we have seen that the exit from the realized price range takes between 5.5 and 10 months. In the current cycle, Bitcoin has only been in this range for three months, which means that the current market range needs to continue for several more months for a breakout to occur.

Long-term investors are still in profit
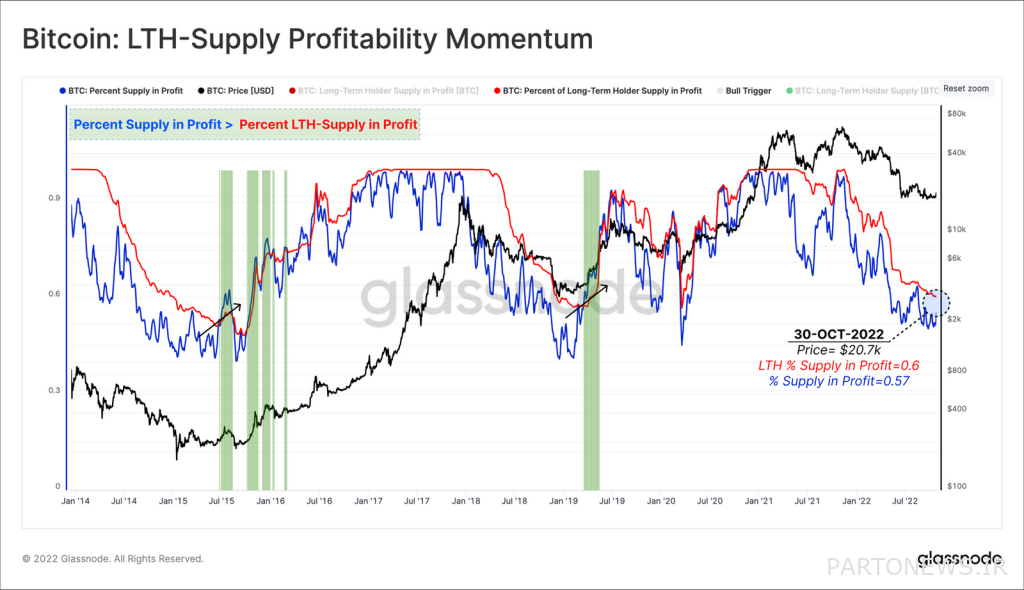
Investigating the realized price in terms of long-term investors compared to short-term investors can also give us a better understanding. Long-term investors make up the majority of Bitcoin supply in profit, so they have less stress to sell and if they do, they are still in profit. Currently, 56% of the total Bitcoin supply is in profit, while if we consider only long-term investors, 60% of the supply is in profit.

Previous market cycles have lasted longer than the current bear cycle; But the signs are promising for a repeat breakout, and with long-term investors making up the vast majority of Bitcoin’s supply in profit, selling pressure is likely to be minimal if a massive market selloff occurs.
More tools for on-chain analysis on the platform Evaluation.

