“Arian” technical analysis, 8 June 1402 / Jamande investment group, expectations of traders’ strategy

According to Tejarat News, Pars Arian Investment Company with the symbol “Arian” with a market cap of 30,000 billion is traded in the over-the-counter yellow base market. The process of Arian’s capital increase from the beginning of the share operation from 1984 to last year is as follows:
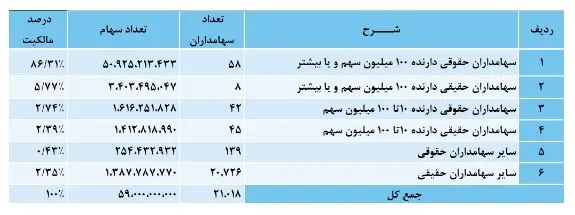
Also, the composition of shareholders is as follows:


Arian’s technical analysis
A look at the price chart of the “Arian” symbol indicates that the long-term trend of the share has fallen into the hands of buyers. In the picture below, you can see the technical analysis of this stock in the weekly interval.
An important point in the technical analysis of Pars Arian Investment Company is the behavioral similarity of the price with the previous correction period, which corresponds to the year 1992 to 1997. The exit from the previous compression that was in the mentioned period of time brought a growth of 2,380% (25 times) for Arian shareholders.
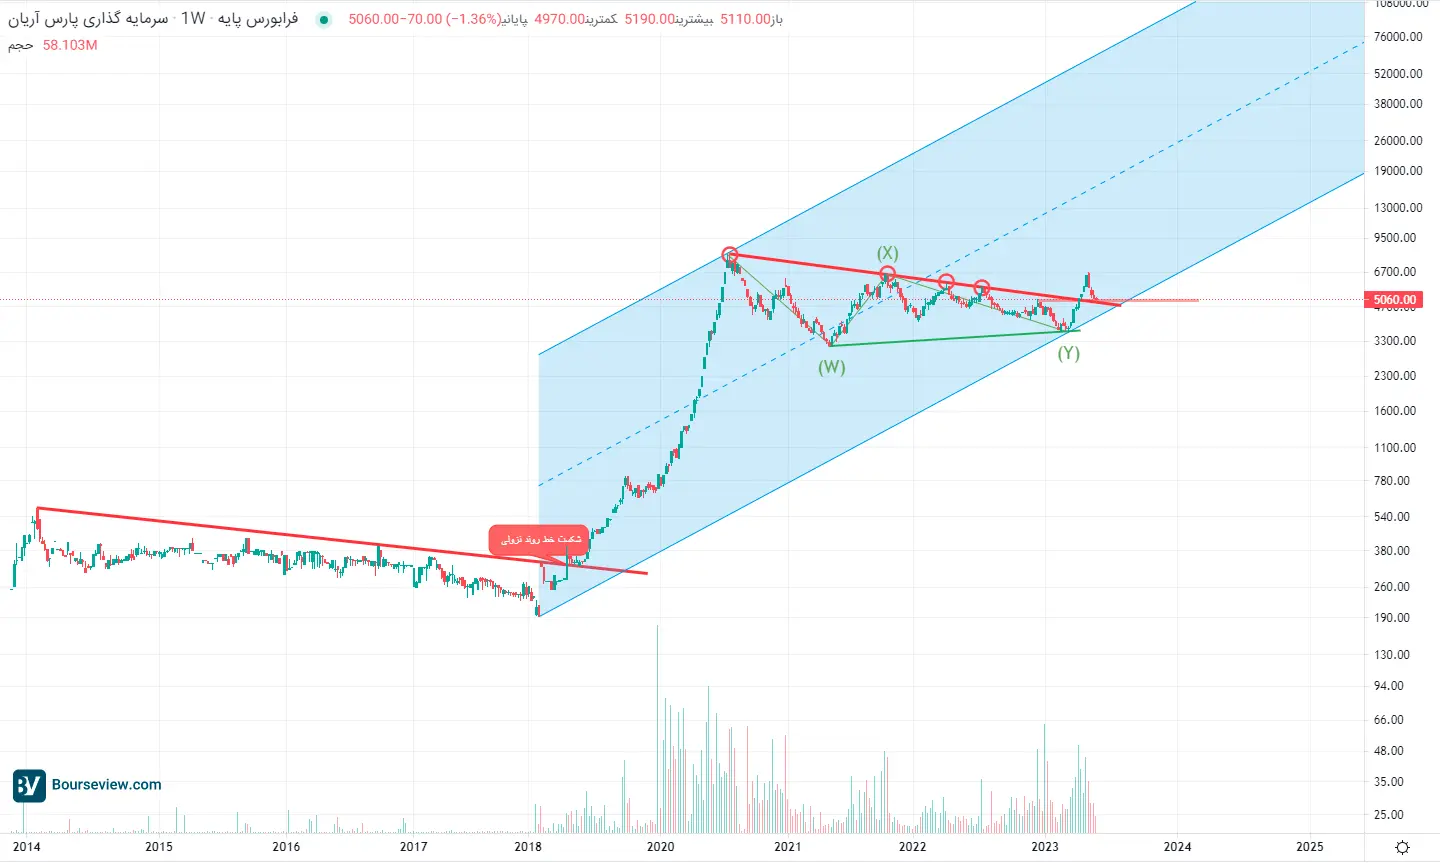
After reaching the historical ceiling of 806 Tomans in July 2019, Aryan’s share entered its erosive correction process, so that it took 1000 days to cross the downward trend line (marked in red in the chart) from the time of the correction.
It is worth mentioning that before the breaking of the strong downward trend line of “Arian” in April of this year, the share buyers tried to break this downward line three more times, and they were defeated by the share sellers every time.
It should be noted that the correction process of Pars Arian Investment Company has been in the form of three XYZ waves and the current conditions of the stock indicate that the long-term perspective is in the hands of the buyers and the correction process has ended. (As long as the price floor of 360 Tomans is maintained, this statement is valid.)
The intersection of the downward trend line and the static level of changed polarity (Change Polarity) of 490 to 504 tomans, which is the previous ceiling of the share, has provided reliable support for the “Arian” symbol.
If the power of demand in “Arian” share succeeds in maintaining valid support in the symbol chart, the ranges of 660 tomans, which is the last ceiling of the share, and the range of 982 tomans, which is the level of 1.618 of the recent upward wave, are the targets of the symbol of Arian.
Read more reports on the stock news page.