Ascending sign on Polkadat and Kozama chart

A technical indicator indicates that Polkadat and Kozama could start a new uptrend despite the downturn they have experienced in the past 10 days. However, the condition for the formation of this uptrend is the passage of key resistance to price.
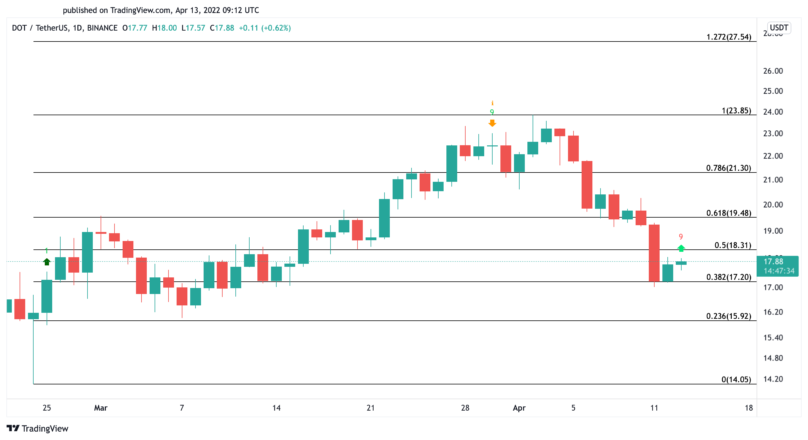
To Report Crypto Briefing, the price of Polkadat has dropped 28.72 percent since reaching a high of $ 23.85 on April 2. The price near $ 17 has formed a new support, and meanwhile, a technical indicator indicates that the Pulkadat market is in a saturated state and could experience a significant jump further.
The current situation of the Tom DeMark Sequential Index in the 1-day market view shows that the current levels can be a good opportunity to buy Polkadat. This indicator identifies points where the price trend may change. More precisely, if 9 consecutive candlesticks close or lower than the end point of the 4 previous candlesticks close, then the market trend is expected to be reversed.
This bullish outlook is also shaped by the formation of the ninth red indicator of this indicator, which may be accompanied by one to four upward candles or the beginning of a new upward movement. Increasing buying pressure at current levels can help complete this bullish outlook.
Closing the daily candle above $ 18.30 can encourage buyers to be more active in the market. The break of this resistance will be a confirmation of the uptrend in the Tom Dimark sequential index, after which the price may rise to $ 19.50 and even $ 21.

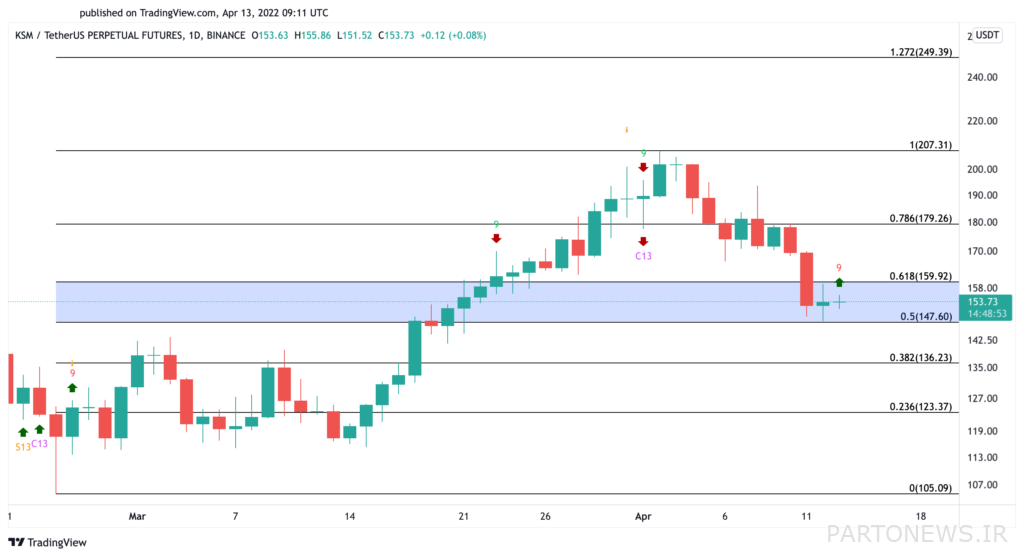
Kozama, like Pulkadat, has now reached a critical juncture after rising sharply on April 4 (April 14) where rising demand could cause prices to jump. The $ 148 support in recent days has prevented the price of Kozama from falling, and the upward return of the price can start from this area. Of course, the price is facing a key resistance at the level of $ 160 to jump to higher levels.
The same applies to the Tom Dimark sequential index in the Kozama market, and the ninth red indicator of this indicator can be seen in the image below. Kozama must reach above $ 160 in order to validate this bullish outlook. After that, we can expect a price jump of up to $ 180 and then $ 207.

To shape this uptrend, Polkadat and Kozama must both move away from the support on their charts and move upwards. Falling below $ 17 opens the door for a deeper drop to $ 16, and if Kozama fails to hold $ 148 support, the price may fall to $ 136 until further support.

