Atrium price analysis; Is it possible to reach $ 3,200?

Despite the price of Atrium reaching above $ 3,500, in the time frame of several months, we are witnessing the emergence of several downtrends, which indicate a possible decrease in the strength of the uptrend.
to the Report Kevin Telegraph, Atrium is currently at risk of falling below $ 3,200. However, the atrium is approaching its strongest resistance and may experience a relatively sharp decline if it does not pass through this area.
Since the beginning of this month, the price of Atrium has risen by 22%, along with the growth of other digital currencies in the market. With this growth, Atrium has gone from below $ 30,000 to a peak of $ 3,650. It is worth noting that only 9 days have passed since October and we can expect further growth of this digital currency by the end of the month.
David Gokhshtein, CEO of the PAC Protocol Network, tweeted, predicting a $ 10,000 price for Atrium:
All I can think about is the reaction of the unique tokens market to this.
Crypto Cactus, a leading Twitter analyst, wrote about Atrium:
$ 6,000 arrives very quickly; The story is about reaching $ 10,000.
As we have said, we are witnessing the intersection of several downtrends on the chart that may affect the upward trend of Atrium prices.
Two areas of resistance and ascending angle
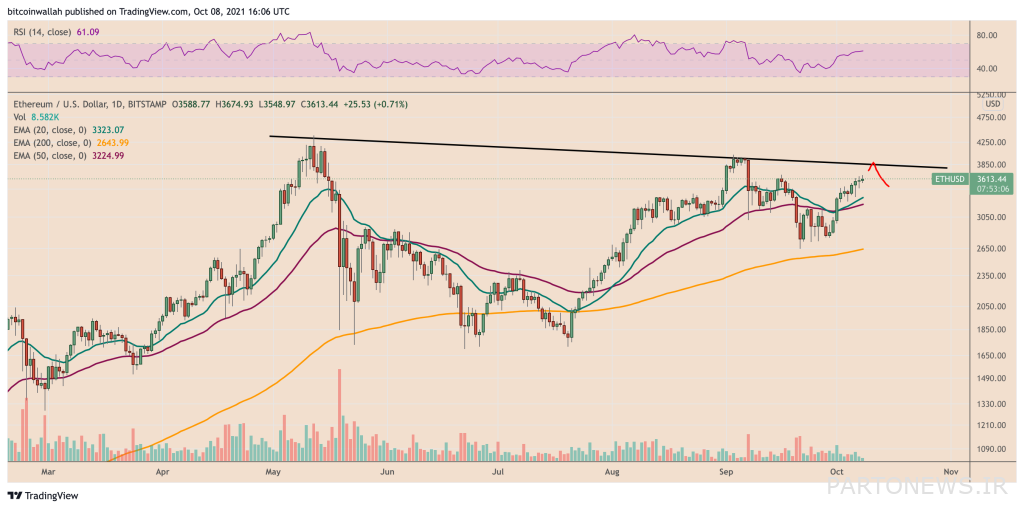
Analysts have cited the uptrend, resistance in the downtrend line and the temporary resistance zone we see in the chart as factors that may lead to the beginning of the downward trend in Atrium prices and the change in the current trend.
After the atrium passed through a series of higher peaks and lower floors, an ascending angle also appeared on the graph. On the other hand, we saw an uptrend along with a decrease in trading volume, which indicates a lack of uncertainty among traders about the uptrend in the Atrium market.
In addition, the culmination of this structure, which is the intersection of trend lines, is located near two historical resistance zones. The first resistance area is the short-term resistance area, which previously prevented further price jumps at 3,650.

The second area is the downtrend line, which can be clearly seen in the daily time frame of $ 3,800.
The peak of the uptrend and the two resistance zones increase the probability of a change in the trend and a downturn in the market. In that case, the price of Atrium should be expected to fall. This fall may be as large as the peak of the trend line; That means a drop below $ 3,200. This area was a price stabilization area in the first half of September.
Inverted head and shoulders
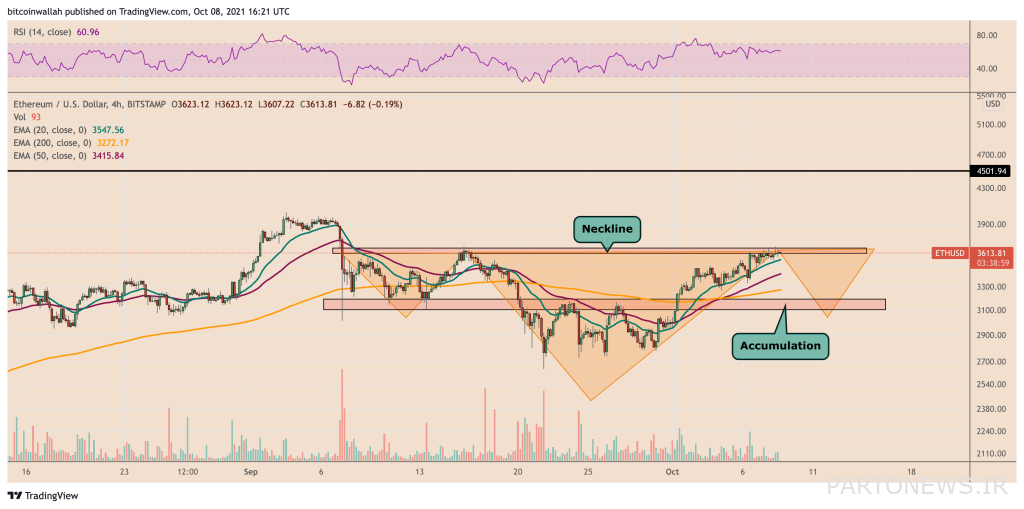
Falling below $ 3,200 does not necessarily mean starting a complete downtrend; That is, it is possible that this fall will form an inverted upward head and shoulder pattern.

If this pattern works as expected, it is likely that we will see a jump in Atrium prices around $ 3,200. This mutation can reach the atrium to the top of the neck (pictured above). In this case, the price of the atrium will fluctuate as much as the distance between the floor and the neck of the model; That means the price could go up to $ 4,500.

