Bitcoin fall below 23 thousand dollars; Is the 200-week moving average supporting the price?

The trend line that the Bitcoin price chart crossed for the first time last month has once again been tested as a support line. In this report, while analyzing the price of Bitcoin, we will examine the effects of the published reports about the sale of Tesla’s Bitcoin reserves.
To Report Cointelegraph Today, the Bitcoin chart hit an important support line after news broke that Tesla liquidated most of its Bitcoin holdings a few months ago.
The newly broken resistance is now supporting
Data from Cointelegraph Markets Pro and TradingView show that the price of the Bitcoin/USD currency pair has fallen again after hitting a multi-week high of $23,280. And now it is in the range of $22,800.
The price of Bitcoin fell quickly, but not sharply, after it was revealed that Tesla sold 75%, or $936 million, of its Bitcoin holdings in the second quarter of this year.
Perhaps the reason why the price did not fall strongly is the comment of Elon Musk, the CEO of Tesla, who while avoiding criticism of Bitcoin added that this sale should not be considered as their negative opinion towards this digital currency.
However, the release of this news put an end to the unbridled rise in the price of Bitcoin over the past few days. After the US dollar fell from its 20-year highs, the price of Bitcoin rose along with the US stock market.
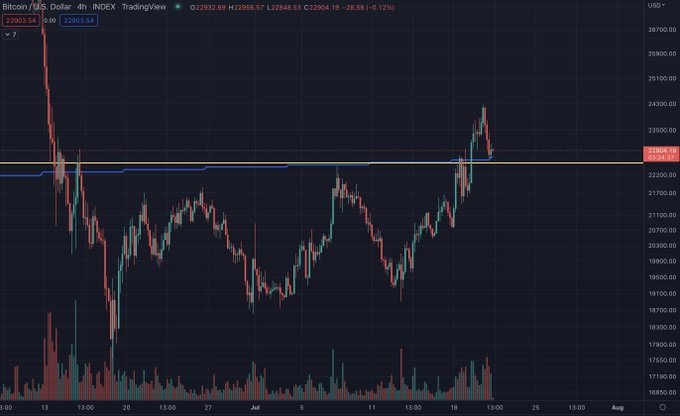
The 200-week moving average of the Bitcoin/USD currency pair is currently in the $22,800 range. This indicator was a key support and trendline for Bitcoin, which was lost and turned into resistance in June. But it was a few days ago that when the price crossed this trend line, it once again became a support for the price.
AskCryptoWealth’s Twitter account writes about this by publishing the following photo:
The Bitcoin price chart is interesting. We see the 200-week moving average (blue line) and reversal resistance. Currently, this trend line has become a support, and the further improvement of the price will depend on maintaining this support.

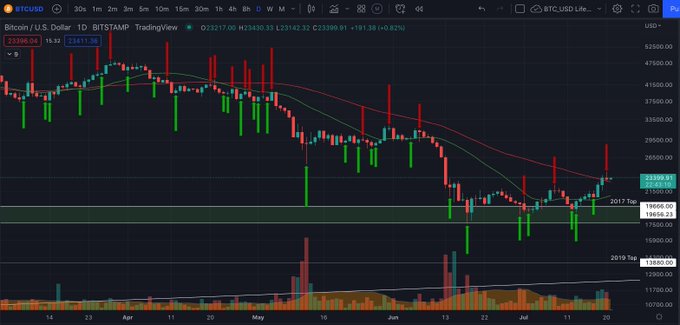
However, in reviewing such analysis, Twitter user Material Indicators reports a different outlook. While price trend weakness is predicted on the daily time frame, monthly trends continue to reflect continued price recovery.
Material Indicators posted the following image to its followers on Twitter:
There is a possibility that the 50-day moving average will be tested again in the near future; But this could mean that we haven’t reached the maximum monthly price yet. Leave the margins and pay attention to the diagrams.

Practically, the 50-day moving average and the 200-day moving average have coincided.

Anatomy of a sale
Other analysts had also looked into Tesla’s bitcoin sales in the middle of last month.
Over a period of several days last month, inflows to exchanges increased, with market makers (MM) releasing more than 63,000 bitcoins.
Ki Young Ju, CEO of CryptoQuant, wrote in a tweet on June 15:
Over the past three days, market makers in the Coinbase exchange have sent the equivalent of $63,638 worth of bitcoins to several exchanges such as Binance and Bitfinex. This volume of sales was done by someone’s order.
Meanwhile, according to data from analytics firm Glassnode, news of the sale has yet to significantly change the trading of panicked sellers or opportunistic buyers.


