Bitcoin fell below $ 18,000; 3 signs to return the price

The price of Bitcoin has fallen below $ 18,000 for a short time following the recent decline, and it can now be said that the feeling of fear in the market has reached its peak in the last few years. However, several important price indicators indicate that current levels are unlikely to last long and that an upward correction in prices may begin to take shape in the near future.
To Report Coin Telegraph Just like in previous years, as the Bitcoin downturn escalated, the stereotype that “Bitcoin is dead again” once again came to the fore, and as usual, a cheerful crowd shouted that Bitcoin was no longer at the bottom of the line. it is arrived.
The past few months have been a difficult one for digital currency market investors, and the price of bitcoin has now fallen to its new low of 2022, at $ 17,600; But as it turns out, the “death of bitcoin” is set to have the same fate as the previous 452 crashes, each of which at the time was considered the end of the digital currency’s heyday.
Determined bitcoin investors, however, always have access to certain tools and indicators within the chain that can help them identify the right levels to buy and enter the bitcoin market. Now that the market is in a big slump, it’s time to look at these indicators and see what information these tools give us about the current price situation.
200-week moving average and its permanent support
One of the indicators that has always appeared in the past in the role of constant support for Bitcoin is the 200-week moving average; An important level mentioned by Rekt Capital, the digital currency analysis on Twitter, about a month ago.
The green circles on the chart above indicate that the price floors of previous downtrends were formed somewhere near the 200-week moving average (higher or lower); This shows that this moving average is one of the key supports of Bitcoin over the years.
As can be seen from the chart above, Bitcoin usually tends to fall rapidly below its 200-week moving average very quickly and then slowly follow its path to return to the top of this level and start a new uptrend.
Bitcoin is currently below its 200-week moving average and has fallen as fast as ever in the past. It is worth mentioning that the price fell below this level for the first time on June 14 (June 24).
While falling below current levels is not far-fetched, as the price history shows, it is unlikely that bitcoin will remain below this level for long periods of time.
Multi-year support that should be monitored
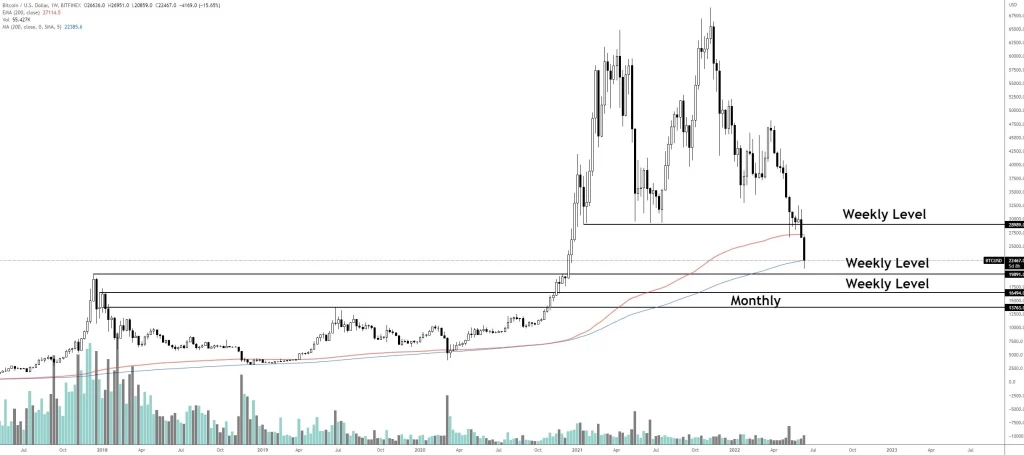
In addition to the 200-week moving average support, Bitcoin has been building support on its chart for years, which could prevent prices from falling to lower levels if the downtrend continues.

The last time Bitcoin was traded below $ 24,000 dates back to December 2020. At that time, the price of Bitcoin went up after hitting the support of $ 21,900 and started a new upward movement to the peak of $ 41,000.
As can be seen from the chart above, $ 20,000 and $ 19,900 support has been lost, but the $ 16,500 level can still be a major support for this digital currency.
An intra-chain indicator that indicates now is the time to start accumulation
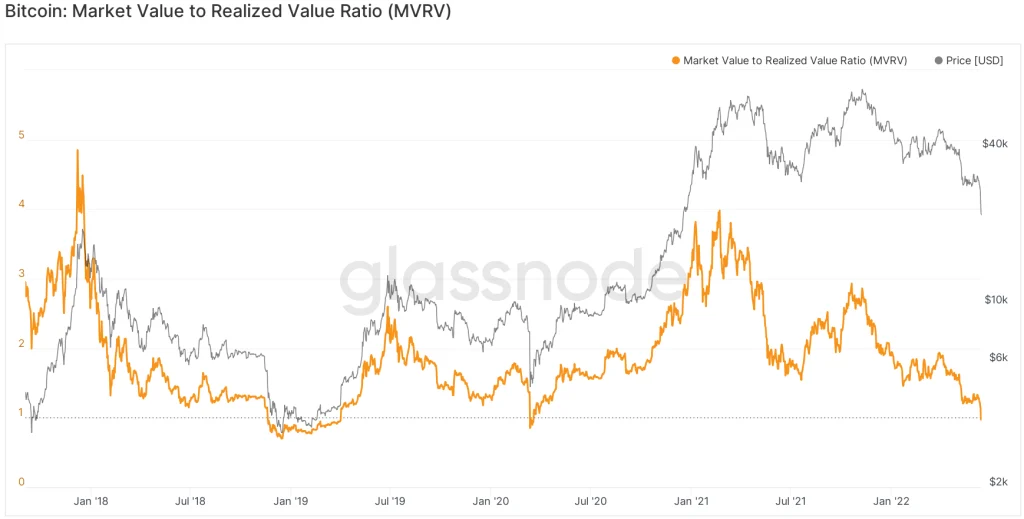
One of the most important indicators in the Bitcoin chain called “MVRV”, which measures the ratio of market value to the realized value of the Bitcoin market, is now at the level of 0.969 and indicates that the market is on the verge of entering the accumulation phase. It should be noted that to calculate the realized market value of a digital currency, instead of the market price, the last purchase price of all its circulating units is calculated.

As can be seen from the chart above, the Bitcoin MVRV ratio has been largely above level 1 over the past four years; Except for two short periods that go back to previous bitcoin cycles.
Simultaneously with the fall in prices in March 2020, this index fell to the level of 0.85 and remained below the level of 1 for almost seven days. During the downtrend in 2018 and 2019, the MVRV index fell to the bottom of 0.6992 and remained below 1 for 133 days.
While these data do not rule out the possibility of a deeper fall in bitcoin in the coming days, they indicate that the worst price correction has probably already occurred and that the recent price spikes are unlikely to last long.

