Bitcoin is likely to fall to $ 40,000; What do analysts say?

Bitcoin fell 9 percent to $ 45,672 yesterday. Analysts now say there are signs on the chart and in the mid-range index that could lead to further price drops to the $ 40,000 level.
To Report Coin Telegraph, the short-term outlook for bitcoin prices has worsened since falling to $ 45,672 in one day. This point is a long way from the $ 50,000 level that investors are hoping to cross over the weekend.
As the year draws to a close, 33 percent of the time, traders are likely to lower their expectations again, postponing the $ 100,000 target for Bitcoin to 2022.
Daily traders, 4-hour market watchers and investors who have opened high-leverage buying opportunities are probably scared now; Unless they have entered short positions (sell) over the weekend when the price of Bitcoin was $ 50,000 or with the price falling yesterday. Now let’s take a closer look at the price of bitcoin.
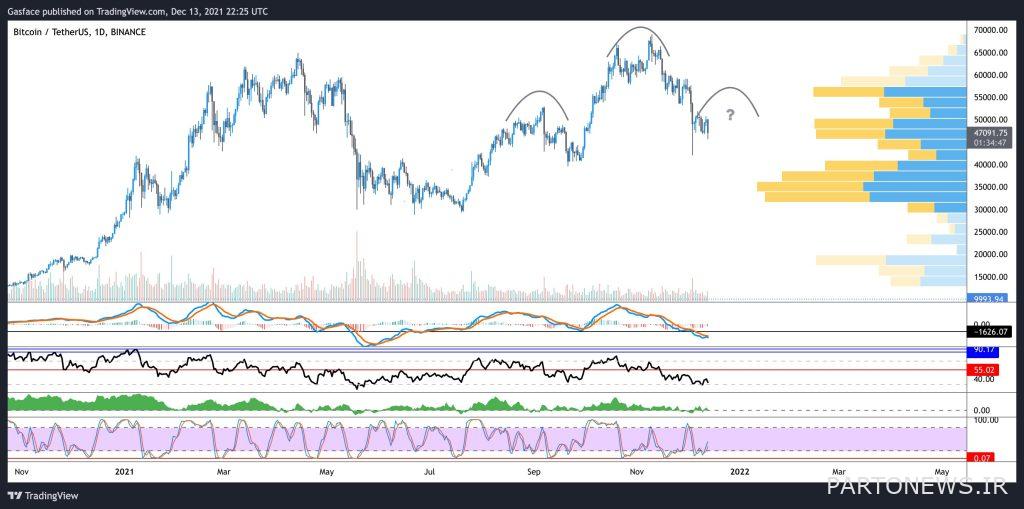
In a one-day period, it can be seen that the price is trying to move away from the daily downside trend, and regardless of the price falling to $ 42,000 on December 4, traders seem to want to buy at the last price floor.
Tracing moving averages has always been a relatively simple way to trade bitcoins, and now the 20-day moving average (blue line on the chart) is below the 50-day moving average (orange line on the chart). Some analysts simply buy and sell an asset when the daily candle is closed several times above the 20-day moving average and sell when the price falls below it; Because it shows that the short-term trend is weakening.
In this case, traders operating on the acceleration of price movements may wait for the Bitcoin price to close above the moving average at $ 53,000 before opening new buying positions. More risky traders may also see the expectation of convergence between the 20-day and 50-day moving averages as a clearer sign that the trend is reversing. A quick look at price movements over the past year proves that this strategy is relatively effective.
Why do some traders expect the price to fall deeper?
More experienced traders know that the price of Bitcoin, after reaching historic highs, tends to create patterns of twin or M-tops ceilings. Recently, analysts on Twitter pointed to the formation of a twin-roof pattern, which is clearly a reversal pattern and in the opposite direction of market trends.

Also read: Familiarity with 10 Technical Analysis Chart Patterns That Every Trader Should Know
Looking at the time interval of 1 day, we can see how the Soroshaneh pattern started. Current price floors and subsequent stabilizations can eventually complete the right shoulder. The neckline is at $ 41,500 and the pattern is so low that we would rather not write it here!
Traders have also pointed out that the formation of the neckline in the Soroshaneh pattern is accompanied by a wide gap in the “VPVR” index. The index, which measures trading activity at different price levels, shows that investors’ interest in buying increases as the price reaches the $ 40,000 level.
It is too early to talk about the existence of the Soroushneh model. On the other hand, the analysis of price movements can not be defined by a single index, but it is still something that is worth noting.
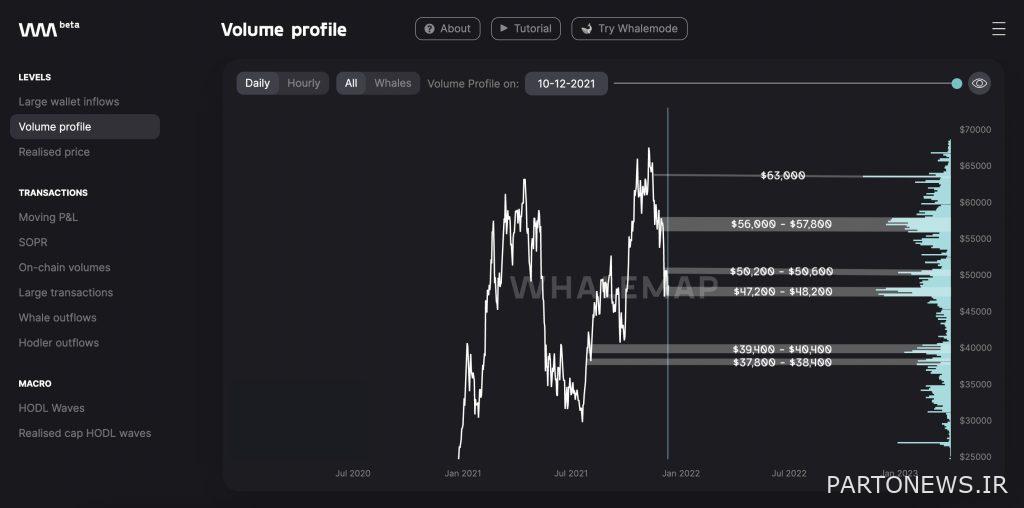
The data from the analytical platform Whalemap also introduced the level of $ 40,000 as an area that should be closely monitored.
Will Map analysts have said in this regard:
Basically, if we start closing the daily candlesticks below the specified support level, the price will probably fall to lower levels. The closest point to current levels is in the $ 40,000 range.

Current Bitcoin price movements do not win the trust of traders who have bought at higher levels or expect to trade at a price between $ 74,000 and $ 80,000; However, Mohit Sorout, a digital currency market analyst, recently said that periods in which capitalization rates are negative are good opportunities to buy.
The term capitalization in the futures market refers to the amount of commission that long-term holders (those who believe prices are rising) and short-term holders (those who believe prices are falling) must pay to keep the market in balance.
Over the course of a day, the MACD and the Relative Strength Index (RSI) are in saturation. Looking at the historical trend of both of these indicators, it seems that the accumulation phase in the market has begun and there is a good opportunity to lower the average purchase price by entering new long positions.

