Bitcoin price analysis; The start of the uptrend depends on maintaining support at $ 42,000

Several indicators of technical analysis indicate that despite the news of rising inflation and the possibility of a conflict between Russia and Ukraine, the price of bitcoin will begin to rise.
To Report Kevin Telegraph: Investors’ concerns about the Federal Reserve’s measures to control US inflation, along with news such as the possibility of a Russian-Ukrainian conflict, have caused the digital currency market to fluctuate.
The data show that the price of Bitcoin is in the range of close to $ 44,000, which gives traders hope that the reverse, complete head-to-shoulder chart pattern will begin.
In the following, we review the opinions of several prominent market analysts. They believe that despite issues such as US inflation and the war in Ukraine, the price of bitcoin will continue to rise.
Predict the upward return of the price according to the equilibrium volume index
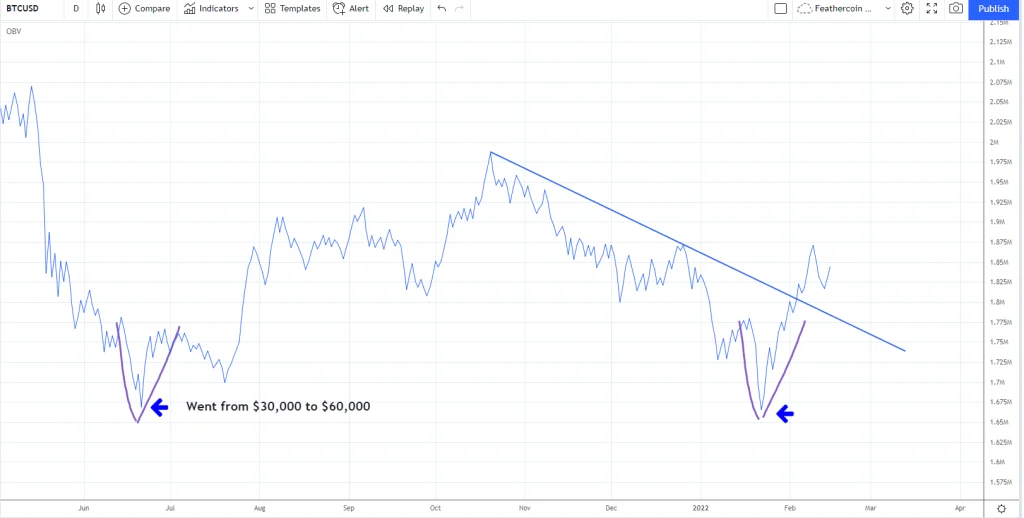
The Twitter analyst of the digital currency market, nicknamed IncomeSharks, according to the Equilibrium Volume Index (OBV), while publishing the following chart, emphasized the return of the upward trend of Bitcoin prices.
The On-Balance Volume Index is a technical indicator of the moment type that uses the volume of trading volume to predict changes in asset prices.

The analyst added:
Many tell me that we have not yet reached the price floor; But the recent trend is higher than the previous price increase from $ 30,000 to $ 60,000. We have two price floors with a “V” pattern and a steep upward slope. Price movements are just unnecessary fuss. Many people value Twitter analytics.
Uptrend provided support of $ 42,000
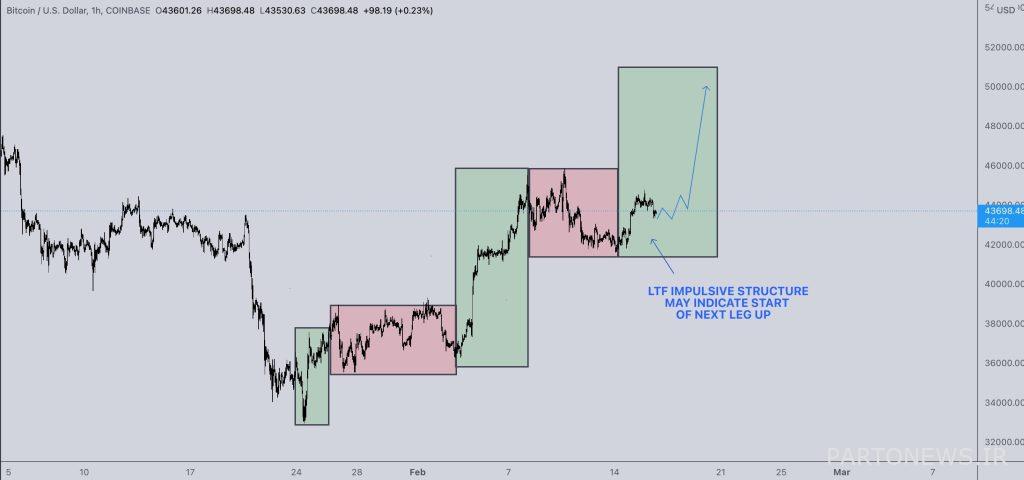
Another Twitter analyst, nicknamed CredibleCrypto, also released a short-term chart showing that the price of Bitcoin has the potential to rise.

The analyst said:
Strong upward jumps continue along with small corrections. The bitcoin price trend is likely to continue as long as the $ 42,000 support is maintained in the short term.
Also read: Bitcoin Price Analysis: More Leap or Return to Old Floors?
The price of bitcoin can grow by 25%
Finally, in the opinion of Twitter analyst Caleb Fransen, we should also mention that the momentum also takes into account the price. He published the following chart, to which the “Williams% R” oscillator has been added. This oscillator is a momentary indicator for measuring the saturation levels of sales.

Frances said:
When there is a complete fluctuation from the amount of sales saturation to the amount of buy saturation, a momentary pressure occurs. Bitcoin price chart has experienced this mode 6 times since January 2020.
After this weekly pressure, the average monthly return has reached 25%. The 4-week momentum pressure is currently being completed, as the Williams% R oscillator indicates. If Bitcoin has a strong weekly closing price, I would be very optimistic about its uptrend.
The total market value of digital currencies has now reached $ 1.9999 trillion, and Bitcoin has maintained its 42% dominance rate among digital currencies.

