Bitcoin price prediction with market cycle psychology; Has the bull market started?

Understanding market psychology is essential to the success of any investment. Long-term investment as well as short-term transactions at different stages of the Bitcoin and digital currencies market cycle is not an easy task due to the influence of emotions on people’s decisions, and for this reason, we intend to examine the psychology of the financial market cycle together in this article and a method Let’s learn to recognize the different stages of the Bitcoin market.
Humans naturally deal with emotions in business, social interactions, and many other day-to-day activities, so they are emotionally involved in investing and trading. Two ends of the spectrum of emotions of traders or investors the fear And Greed Is. In short, absolute fear is similar to a situation where a person feels that he has suffered a heavy loss and is no longer able to compensate for it. Absolute greed is also often referred to as a situation where people are confident that the profits they have earned are only the result of their unique trading genius and nothing else can stop them from achieving their dream of becoming rich.
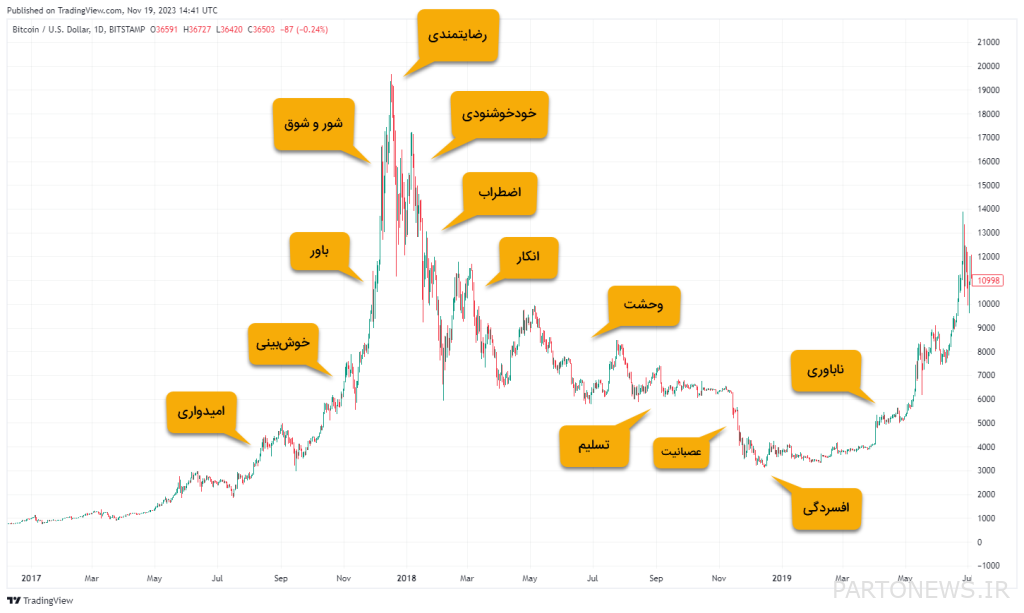
The chart above, known as the Wall Street Cheat Sheet, well depicts the change in investor sentiments at different stages of the financial market cycle. As you can see, this chart starts with a feeling of “disbelief” and ends with the same feeling, which shows that we are dealing with a recurring or cyclical flow. The peak of this chart is the feeling of “satisfaction” that depicts the absolute greed of investors, and the bottom of the chart is where people feel “depressed” because of the disappointment of the market and the heavy loss they have suffered.
This cycle has been repeated many times before in the financial markets. The rise and fall of the price of Bitcoin and other digital currencies in the period between 2017, 2018 and 2019 is one of the clear examples of this cycle that analysts regularly point to.

The Psychology of the Bitcoin Market Cycle
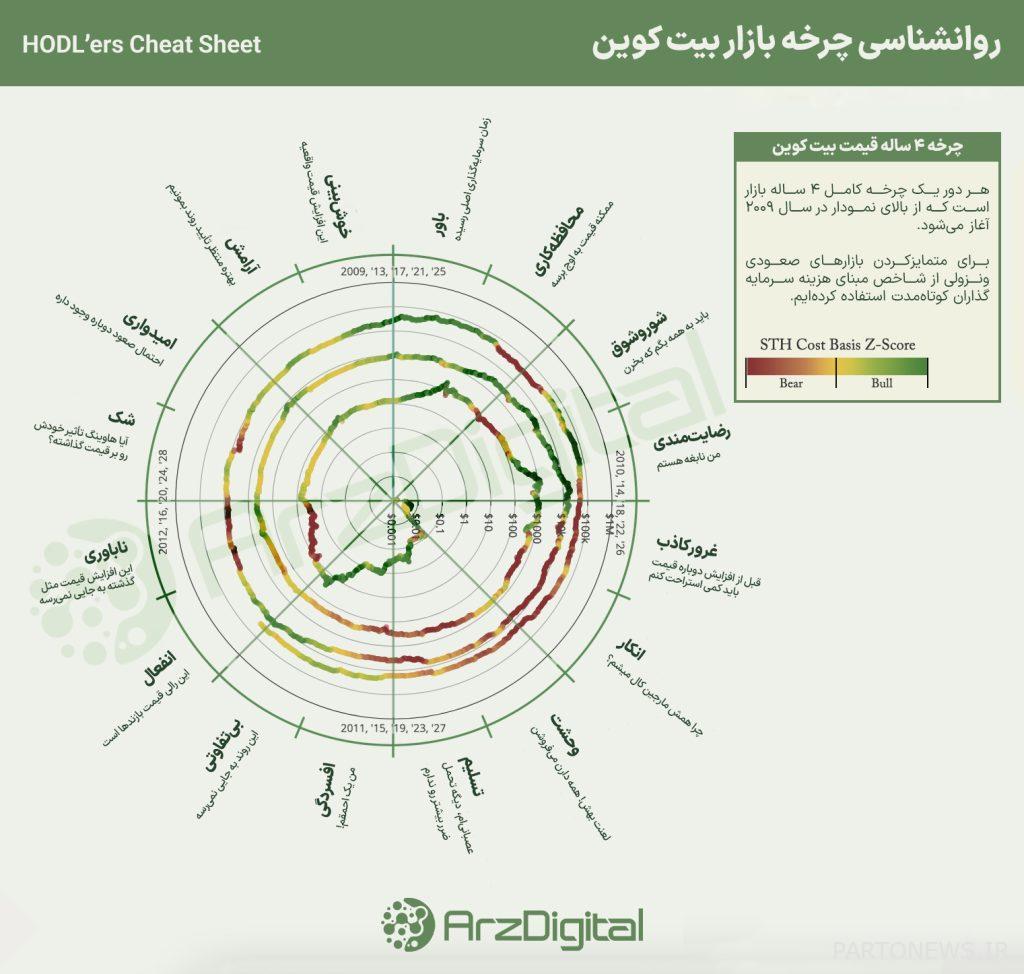
The chart below, designed by Root, an analyst of on-chain data and Bitcoin market cycles, is modeled after the Wall Street cheat sheet, called the HODL’ers Cheat Sheet. This image is an interpretation of the psychology of the Bitcoin market cycle, which shows what goes on in the minds of investors at different stages of the market cycle and helps people manage their emotions in each of these stages.

Since each cycle in the Bitcoin market takes place over a 4-year time period, Root has combined a 4-year spiral chart that is color-coded with on-chain data on short-term Bitcoin holders in the Holder Cheat Sheet. This segment of investors is the most susceptible group to engage in momentary emotions and follows the psychology of the Wall Street cheat sheet very well.
The cheat sheet of holders actually combines three tools together; The spiral chart, the short-term holder cost basis Z-Score index, and finally the Wall Street cheat sheet that we talked about.
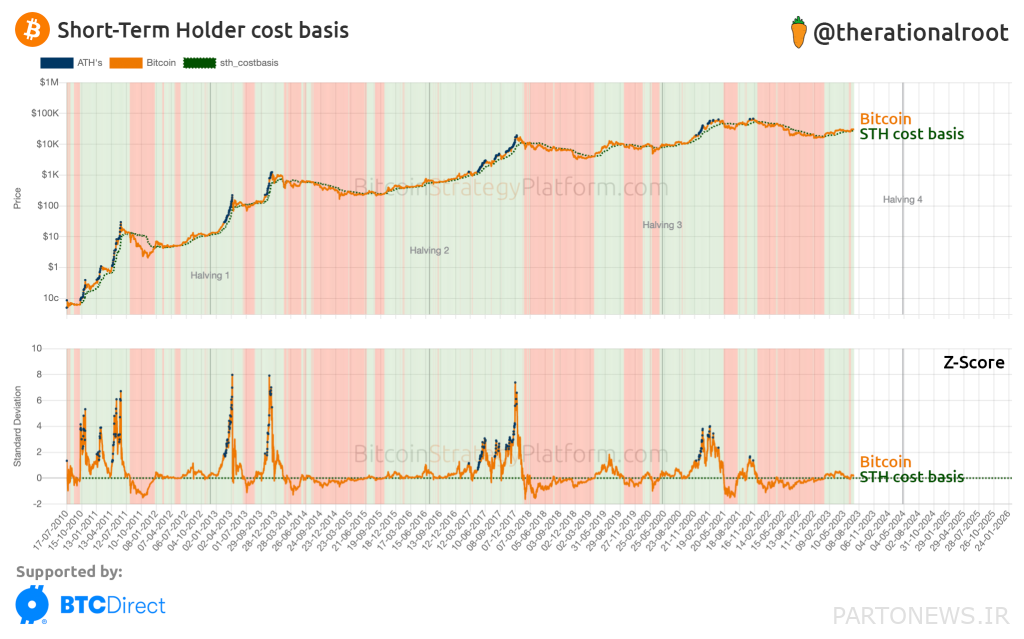
The short-term holder cost basis index shows the average purchase price of inexperienced Bitcoin investors, and its Z-Score version, which Root used, shows the distance between the current price of Bitcoin and the average purchase price of short-term holders, which is measured as a standard deviation. .
Root believes that bullish markets can be distinguished from bearish markets by looking at the STH cost basis Z-Score index. The spiral chart above, which is included in the cheat sheet of the holders, confirms this and it can be said that the density of red dots is higher in the lower half and the density of green dots is higher in the upper half of the circle. As can be seen from the image below, the higher this index rises, the stronger the bull market, and the more it moves below the dotted green axis, the stronger the bear market.

What stage is the market at now?
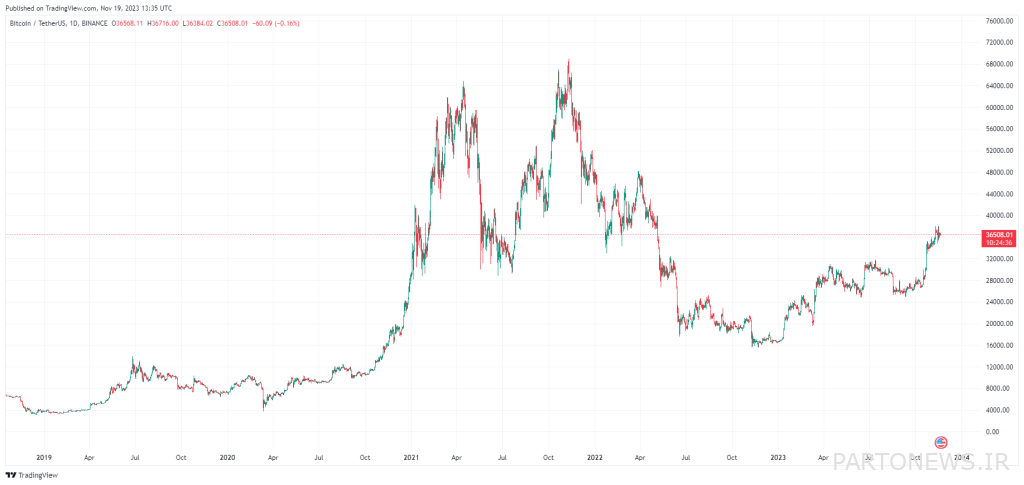
Relying on the root model, it should be said that the Bitcoin market is in the stage of “disbelief” right now and until the beginning of 2024. Passing this stage brings investors into the ascending phases of the upper half of the holder’s fraud sheet circle, which can promise the beginning of a continuous upward movement.

It is true that one can draw a quick conclusion about Bitcoin price growth down the road (until 2026) by relying on the root model, but as has been seen many times, unpredictable events can have a surprising effect on the market and prices, and there are no guarantees. There is no way that a pattern will repeat itself exactly in the future even after repeating itself many times in the market.
Therefore, it is necessary to remember that there is no risk-free and absolutely reliable way to estimate the future price of an asset, and an integral part of any safe investment is risk management to prevent heavy losses and allocate capital to the extent that its loss is even negligible. Complete, do not create a disturbance in the life of the investor.

