Breaking the downtrend in theta and end of crypto modification (CRO); Five digital currencies that traders need to monitor this week

Bitcoin price performance has been disappointing; But traders are hoping that the $ 42,000 jump in support will complement the bullish technical analysis pattern and push up the price of bitcoins and altcoins.
Despite the poor performance of Bitcoin (BTC), the source of data analysis within Ecoinometrics believes that whales are accumulating and the price is more attractive from a long-term perspective.
Pessimistically, Willie Woo, a digital currency market analyst, believes $ 33,000 is the lowest level for Bitcoin. Also active on Twitter, Credible Crypto, citing PlanC data, said it was unlikely that the bitcoin price would fall below $ 30,000.
Chris Kuiper, head of research at Fidelity Digital Asset Management, also believes that the price of bitcoin can be very low compared to other digital assets; But if bitcoin can replace gold as a storehouse of value, then its price will rise significantly.
In view of all these cases, and in order to have a clearer view of the continuation of the price trend of bitcoins and a few selected coins, in the continuation of this article, we will examine the possible trends.
Bitcoin (BTC)
The price of Bitcoin bounced back from its high resistance at $ 45,456 and could not cross the barrier. The only good thing was that the cows supported the 20-day moving average (EMA-20, blue line in the picture) at $ 41,383, which did not allow the price to fall below this level.
If the price returns to the current level, the cows will try to push the Bitcoin / Tetra (BTC / USDT) pair above the $ 45,456 level. Closing the price above this level completes a bullish reversal pattern.
The pair could then rise to $ 52,088, where bears are likely to pose a major challenge for traders. If the bulls raise the price above this level, the pair can start moving up towards the target of the pattern formed at the level of $ 56,904.
However, if the price below $ 39,600 breaks and closes, this positive view will be rejected. Such a move could open the door to a possible drop in the price of bitcoin to $ 36,250.
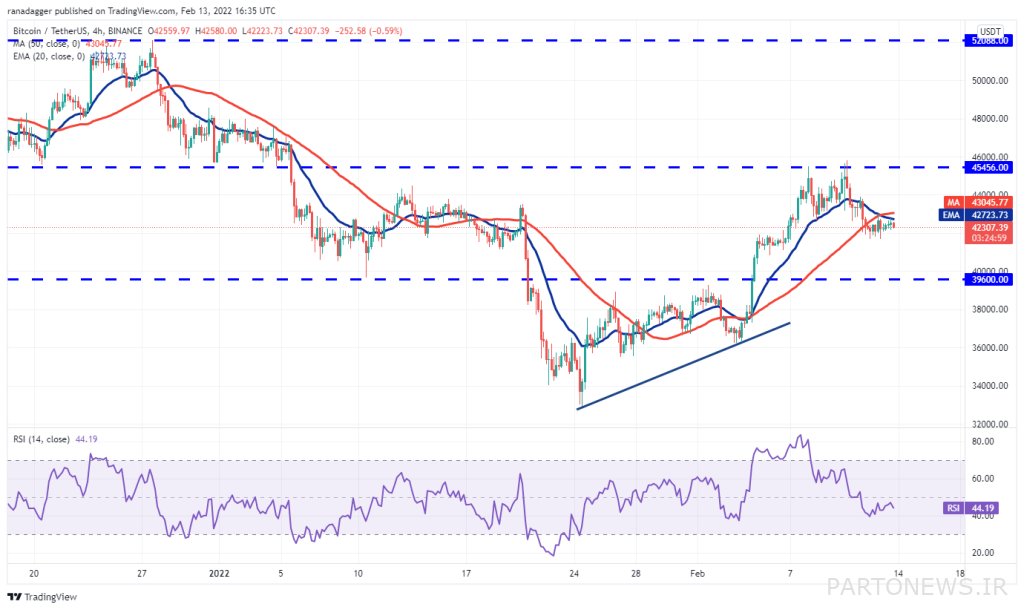
The Bitcoin / Tetra pair fell below the $ 45,456 level and broke below the moving average. The cows are currently trying to defend the $ 41,688.88 support level; But in the range of moving averages, they face hard resistance.
If the price falls below the current level and falls below $ 41,688.88, the pair may fall below the $ 39,600 level. If the price returns from this level, then the Bitcoin / Tetra currency pair may remain in the range of $ 39,600 to $ 45,456 for the next few days.
On the other hand, the break and closing of the high price of moving averages can be the first sign of the re-dominance of cows in the Bitcoin trading market, after which the price will move to the levels of $ 43,920 and $ 45,456.
Ripple (XRP)
The Ripple (XRP) price broke above the moving average on February 7, which could be a sign that the price downtrend is coming to an end. Meanwhile, the bears tried to bring the price back below the $ 0.75 breakout level; But the cows thwarted their efforts.
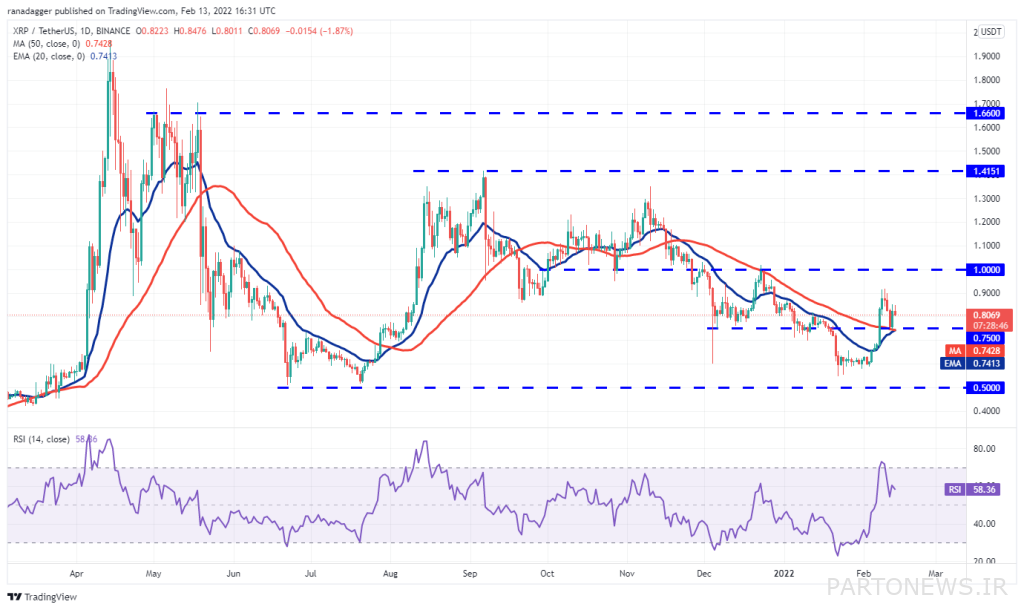
The Ripple price has returned to the $ 0.75 level and the cows are trying to move the Ripple / Tetra (XRP / USDT) pair towards the overhead resistance at $ 1. Breaking the price above this resistance could open the door for a possible rise to the level of $ 1.41.
Moving averages are on the verge of an uptrend, and the Relative Strength Index (RSI) is in the positive zone, indicating that buyers have the upper hand. This positive view will be invalidated if the price breaks and closes below the $ 0.75 level. This indicates that the bears continue to sell in rallies.
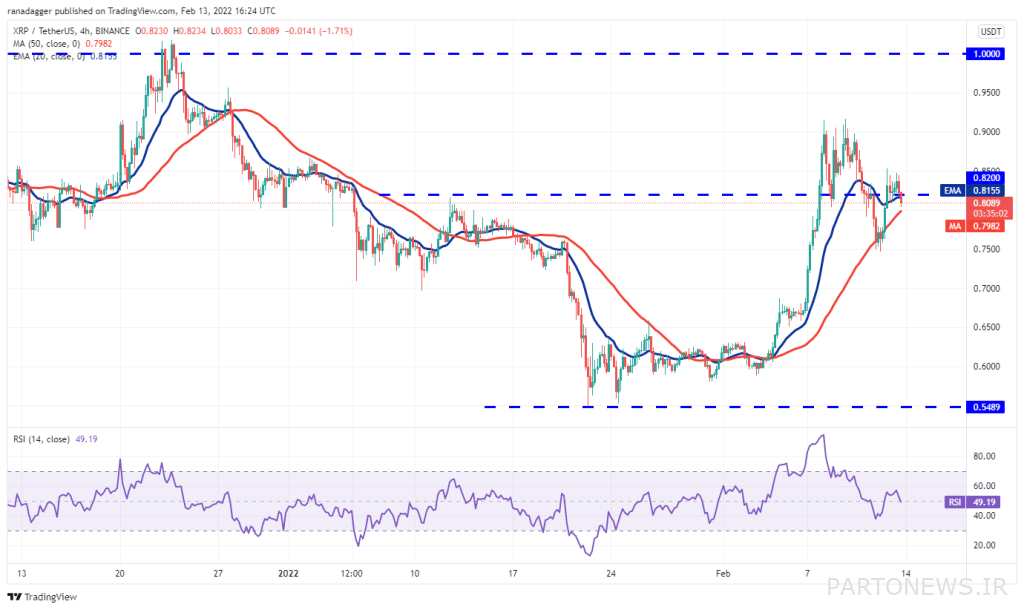
The 4-hour Ripple price chart shows that cows and bears are fighting near the $ 0.82 border. In this struggle, the cows raised the price above this level; But the bears stopped the rally at $ 0.85 and pushed the Ripple / Tetra pair below the $ 0.82 level.
A small positive point is that cows are buying in the range of the simple 50-day moving average (SMA-50, red line in the picture). If the price returns from this support, the cows will try to raise the pair above $ 0.85 and challenge the resistance at $ 0.91. Conversely, a break below the 50-day moving average could push the pair up to $ 0.75. Failure of the price below this support level could indicate the beginning of a deeper correction.
Crypto (CRO)
The price of crypto closed above the simple 50-day moving average at $ 0.47 on February 7, which could be a sign that the price correction phase is likely to end. Meanwhile, the price of crypto on February 10 (February 21) was moving towards the level of $ 0.54, which was met with strong resistance from the bears.
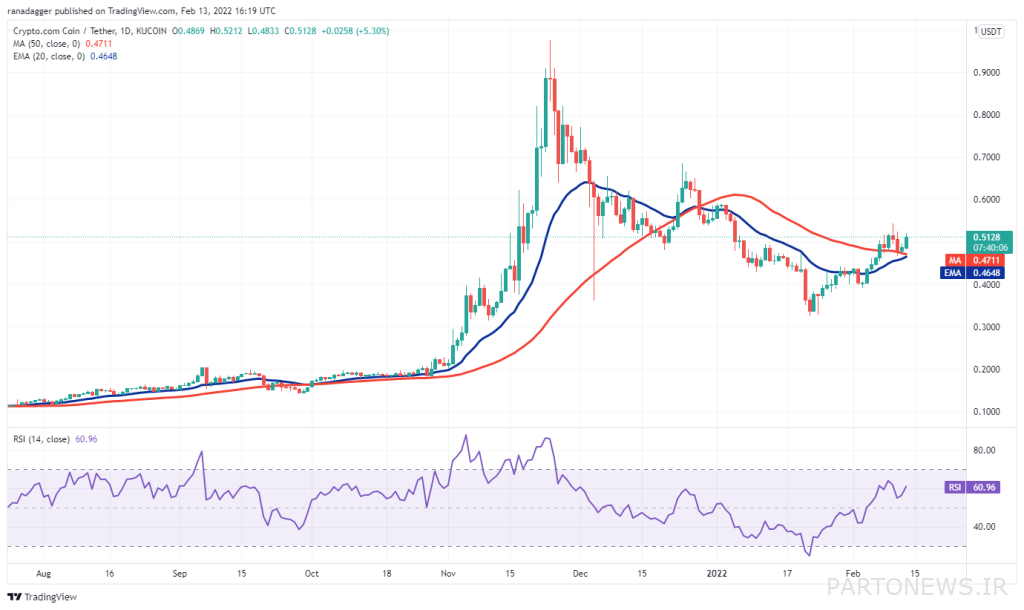
Moving averages on the verge of an uptrend and relative strength index (RSI) are also in the positive range, indicating the slight superiority of buyers. If the current return to moving averages is maintained, this indicates that the cows are buying in a downward direction. They will then try to push the price above $ 0.54 and resume the uptrend.
Now if they can do that, the crypto / Tetra (CRO / USDT) currency pair could rise to $ 0.60 and then to $ 0.68. Contrary to this hypothesis, if the price falls below the 20-day moving average, the pair could fall to the level of $ 0.39.
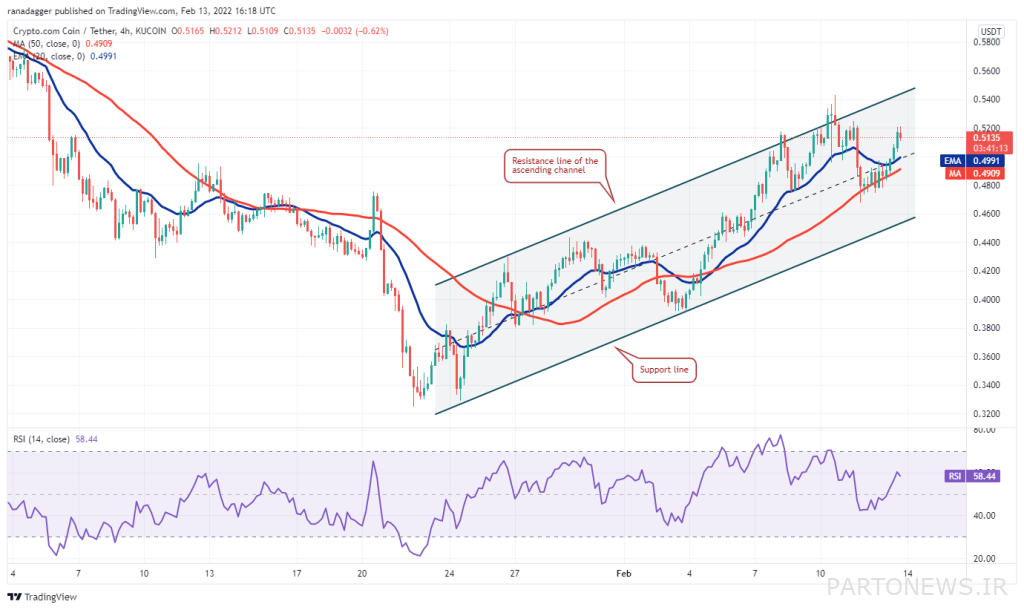
The 4-hour cryptocurrency chart shows that the pair is rising within a bullish channel pattern. The cows tried to push the price above the canal range; But the bears did not allow them to do so and returned the price to the channel.
Buyers are trying to defend the 50-day moving average (SMA-50, red line in the picture). If the price stays above the 20-day moving average (EMA-20, blue line in the picture), the cows will try again to push the pair above the channel resistance line. Now, if the price falls and falls below the channel support line, this positive view will be nullified.
FTX
The price of FTFs is currently fluctuating within the channel, which is due to the inability of cows to raise prices above resistance levels and to be sold by bears in price rallies.
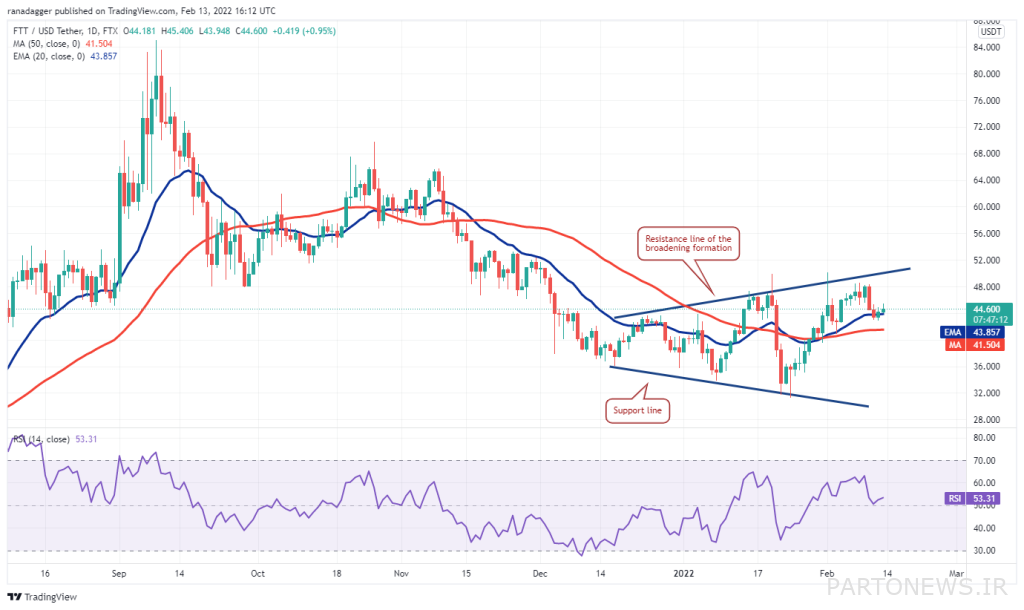
However, cows are buying at low price levels and in the range between the 20-day moving average (EMA-20, blue line in the picture) at $ 43.85 and the 50-day simple moving average (SMA-50, the red line at Image) are at $ 41.50. Now, if the price returns to the current level, buyers will once again try to cross the barrier of overhead barriers.
Now, if they succeed, the FTT / USDT pair could start a new uptrend. The pair could then rise to $ 53.50; Where bears may pose a major challenge again; But if that resistance wears off, the rally could rise to $ 65.
However, if the price falls below the simple 50-day moving average (SMA-50, red line in the picture), this uptrend will be invalidated. This indicates that the currency pair may remain in the expanding pattern in the coming days.
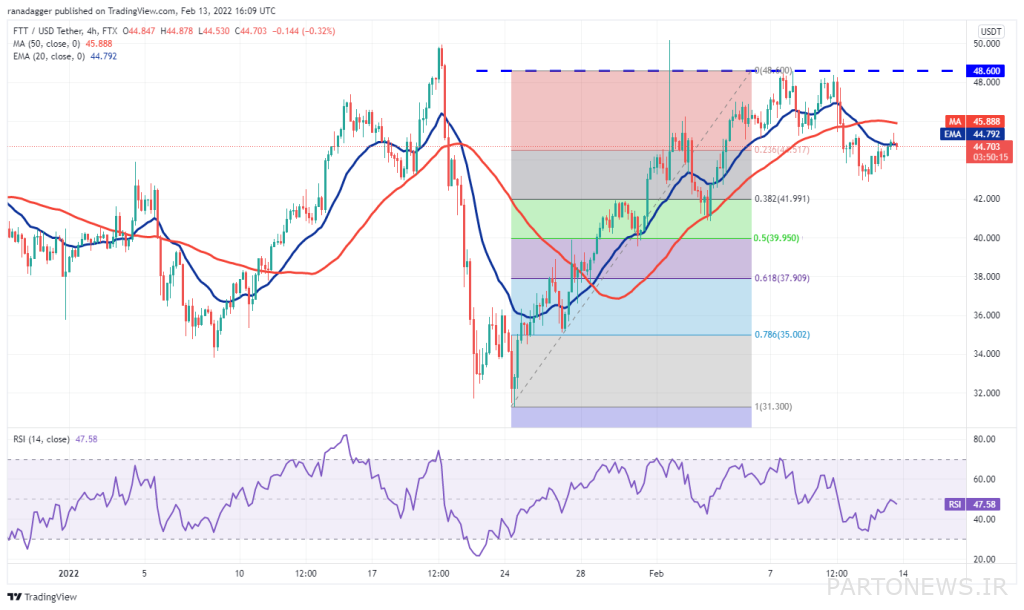
The inability of cows to raise the price to the resistance level of $ 48 to $ 50 may be due to traders saving profits in the short term. The pair is currently broken below both moving averages and could fall to 38.2% Fibonacci levels at $ 41.99.
Now if the price rises from the current level or $ 41.99, it indicates that buyers are accumulating tokens. The cows are also trying to push the price above the simple 50-day moving average again. If they succeed, the pair could challenge the resistance above the head.
On the other hand, the break below $ 41.99 could be the beginning of a deeper correction at $ 39.95 at the 50% Fibonacci retracement level.
THETA
The price of the theta token broke and closed above the downtrend line on February 10, which could be a sign of the end of the theta downtrend. Typically, any price rally formed above the resistance tends to return to the previous failure level.
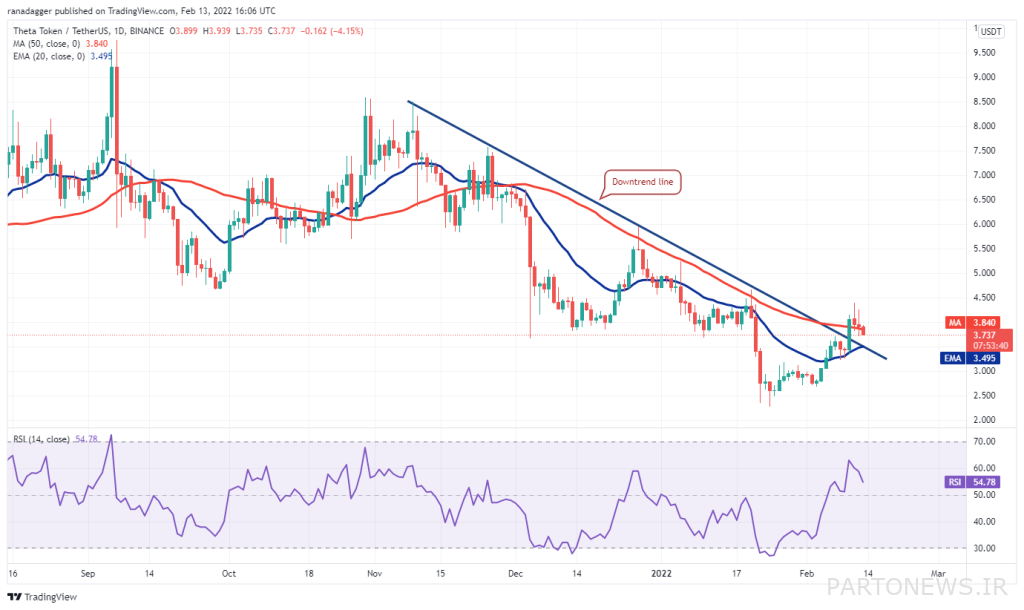
Now, if the cows succeed in turning the current level of failure into support, it indicates a change in the sentiment in the theta trading market, from selling in the rally to buying on the price floor. The 20-day moving average is up at $ 3.49 and the Relative Strength Index (RSI) is in the positive range, indicating buyers’ superiority.
Now if the price returns from the downtrend line, then the cows will try to start a new uptrend. A break above $ 4.39 could attract more buyers and the THETA / USDT could rise to $ 6.
On the other hand, if the price falls below the current level and falls below the downtrend line, this uptrend will be invalidated. Such a move indicates that breaking above the downtrend line could be a bull trap.
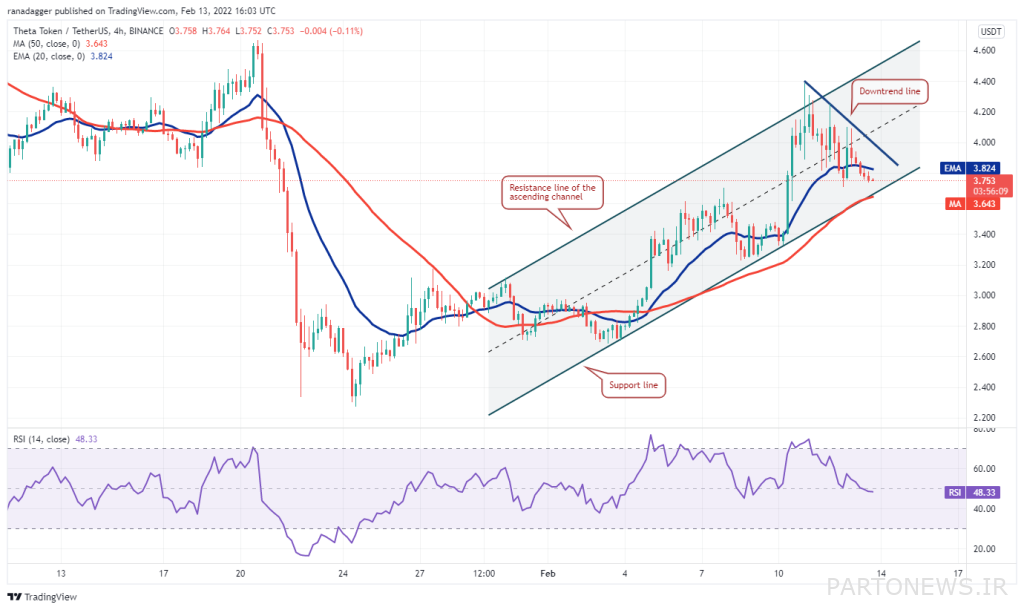
The price of the THETA / USDT pair has been on the rise within a bullish channel pattern. The cows tried to push the price above the channel resistance line; But the bears did not give up. This may be due to the tendency of short-term traders to save their profits, which pushes the price towards the channel support line.
The price of theta has jumped in three stages of the channel support line and the cows are still defending this level. Now, if the price returns from this level and goes above the downtrend line, it will be a sign of resumption of the uptrend.
Otherwise, with the failure and closing of the price below the channel support line, there is a possibility of further correction of the price up to the level of $ 3.20.

