Descending indicators on the Bitcoin chart; Falling or keeping $ 55,000?

Some key indicators point to over-investor confidence and the prolongation of the recent bitcoin uptrend, while a number of experts believe that the uptrend could continue for weeks to months. But how do you know where the market will go next?
to the Report Quinn Telegraph Many analysts and media outlets have recently pointed out that the status of the indicators indicates a prolonged uptrend in bitcoin.
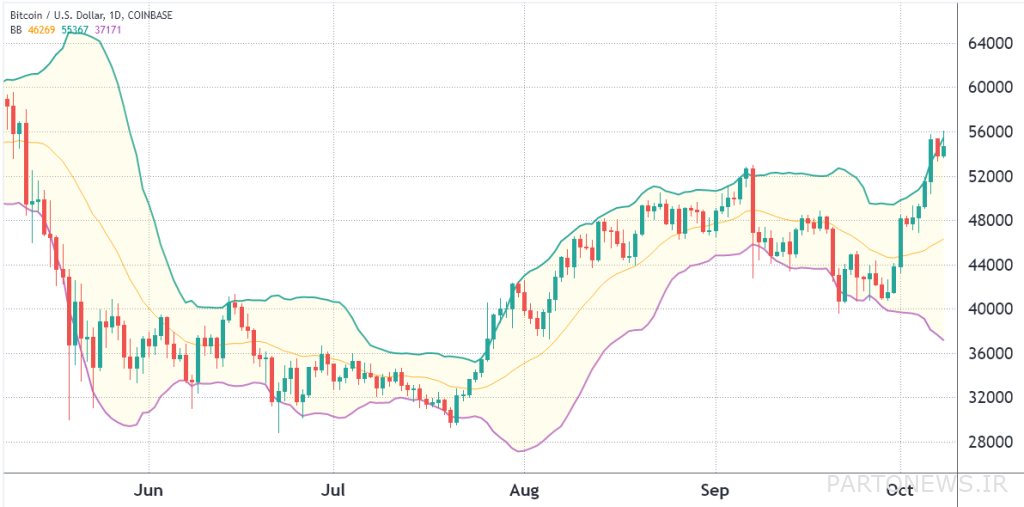
These downtrends, one of which concerns John Bollinger, the creator of the Bollinger Bands Indicator, show that traders in the current market situation are using the Trailing Stop, and this as a sign of Reaching the ceiling is considered in bullish markets.
The Bollinger Bands and the Fear and Greed Index are benchmarks for measuring price returns, so if prices have risen 30 percent as they have in the last seven days, these indicators usually indicate buying saturation.
As TechDev_52, a leading digital currency market analyst, rightly posed on Twitter, there is no way we can tell if the market will continue to undergo a major correction or if the uptrend will continue.
Nebraskangooner, a well-known digital currency market analyst, for example, said the recent high of $ 56,000 could be the culmination of an uptrend in the bitcoin market since late July.
“Nebraska” said:
I’m not sure we should wait for the next rapid price jump [یا خیر]. The equilibrium volume index (OBV) continues to fluctuate within a certain range. We may get stuck in the $ 48,000 to $ 53,000 range in the short term [در صورت سقوط بیشتر قیمت] Admission to the $ 48,000 to $ 51,000 area is also possible. However, there is still a lot of activity in the Altcoins market.
Does the feeling of greed continue in the market?
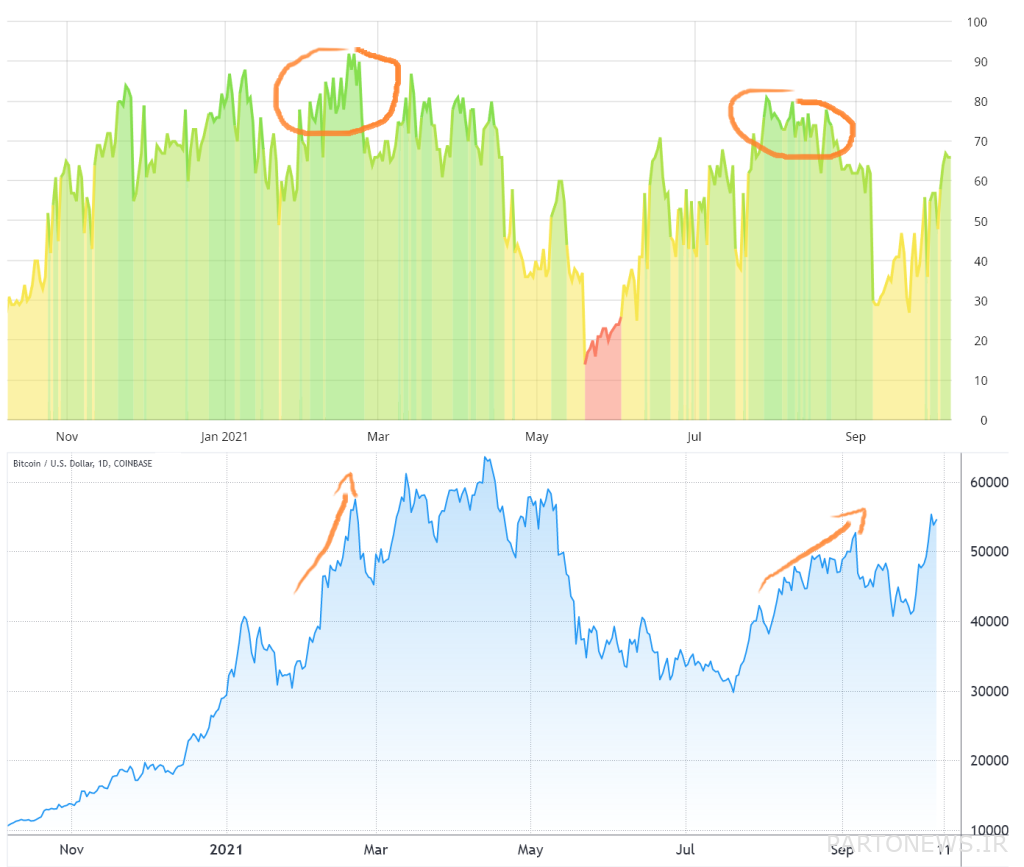
Let’s take a look at the index of fear and greed. The following examples show that this index can maintain buy saturation levels for more than 3 or 4 weeks.

As can be seen from the pictures above, the index of fear and greed between January 29 (February 4) to February 26 (March 28) has maintained its position above 65%, which indicates the overconfidence of traders at that time.
The index measures market sentiment using data on trading volume, open interest volume, social media user activity and search engines. Open contracts are those derivative contracts that have not yet been settled.
After the warning signs on the Fear and Greed Index were seen, it took four weeks for the Bitcoin price to undergo a massive correction. Those who sold their assets in the early days of the downturn in the index lost the 70% price increase that followed.
A similar pattern has been formed between July 23 (August 1) to August 25 (September 3) and at the same time with the continuation of the upward trend in prices. It is true that the price corrects itself as the index of fear and greed decreases, but how can it be said that this correction will happen a few weeks or a few months later?
What does Bollinger Bands say?
John Bollinger is an experienced and respected analyst, but the indicator he introduced is just a combination of moving average (MA) and price deviation based on current fluctuations. In short, given the fluctuations of 4.5 percent on a typical Bitcoin day, a 30 percent seven-day price increase would be outside the Bollinger Bands range for the most part.

Specifically, when the price candle crosses the upper band resistance (green line), the market will experience a slight correction, but its correlation with the bitcoin price will be zero for the next 2 to 4 weeks.
Capital interest rate status
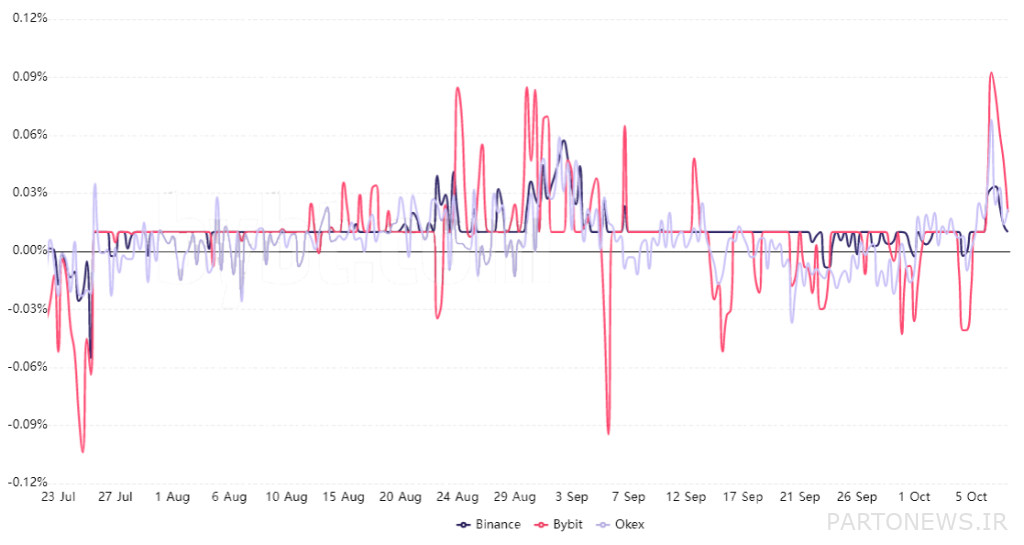
The last thing we need to look at is the status of the Funding Rate. Because trading levers in derivative markets are different, digital currency exchanges charge a fee called the rate of capital to moderate the risk between long-term holders (buyers) and short-term holders (sellers). Obviously, this index grows when the buying pressure in the market increases.

The average 8-hour capitalization rate of 0.04% and 7-day capital of 0.8% is not unusual. For example, in December 2020, the weekly capital supply rate for a full month was above 1.5 percent, and in February 2021 (December 99) the same thing happened again.
This measure, like the Fear and Greed Index, shows that buyers’ self-esteem has increased too much since the 8-hour capitalization rate crossed 0.10 percent, but reaching this level does not necessarily mean a warning.
As long as buyers are confident that the uptrend will continue, paying commissions of 1.5 percent or even 3 percent for the weekly financing rate will not deter them from maintaining long positions. For example, if the decline in bitcoin supply in digital currency exchanges and the accumulation by long-term investors is the main reason for the price jump to $ 56,000, there is a possibility that the uptrend will continue to $ 80,000 and above.
However, if bad news is heard in the near future, such as the rejection of the Bitcoin Exchange (ETF) trading license application by the Exchange Commission or the severe ban on stable coins by US officials, prices are likely to fall. Events like this could prevent the price of bitcoin from reaching historic highs, and eventually downgrade.

