Digital currency price analysis; 5 currencies that have a chance to jump

The S&P 500 stock market index completed its fourth week of gains the day before, while the Central Bank of America announced in its newly published meeting minutes that due to the high inflation rate in this country, the increase in bank interest rates will continue. had The experts of this organization have also said that currently there are no signs of a reduction in inflation in the country’s economy.
Another negative news published last week was the reaction of James Bullard, head of the Federal Reserve in St. Louis, who said he would support another 0.75 percentage point increase in the bank interest rate in September. These currents in total destroyed the hope of investors regarding the end of the era of increasing the rate of interest rate growth in the short term.
The weakening of market sentiment has caused the S&P500 index to fall by 1.29% since the beginning of this week, and Bitcoin, which is highly correlated with this important stock market index, has recorded a loss of 1.6% since the beginning of the week (Monday). .
That said, are buyers looking at this price drop as an opportunity to buy at the bottom? To answer this question, we will review the chart of 5 digital currencies selected this week.
Bitcoin (BTC)
On August 17 (August 26), the price of Bitcoin fell below the 20-day exponential moving average (EMA 20 – blue line in the picture) at $22,864, and until August 19 (August 28) the support of the 50-day simple moving average (MA – The red line in the picture) which was placed at $22,318 was also lost. Now the buyers are trying to stop this downward trend when the price reaches the bottom of the ascending channel on the chart.
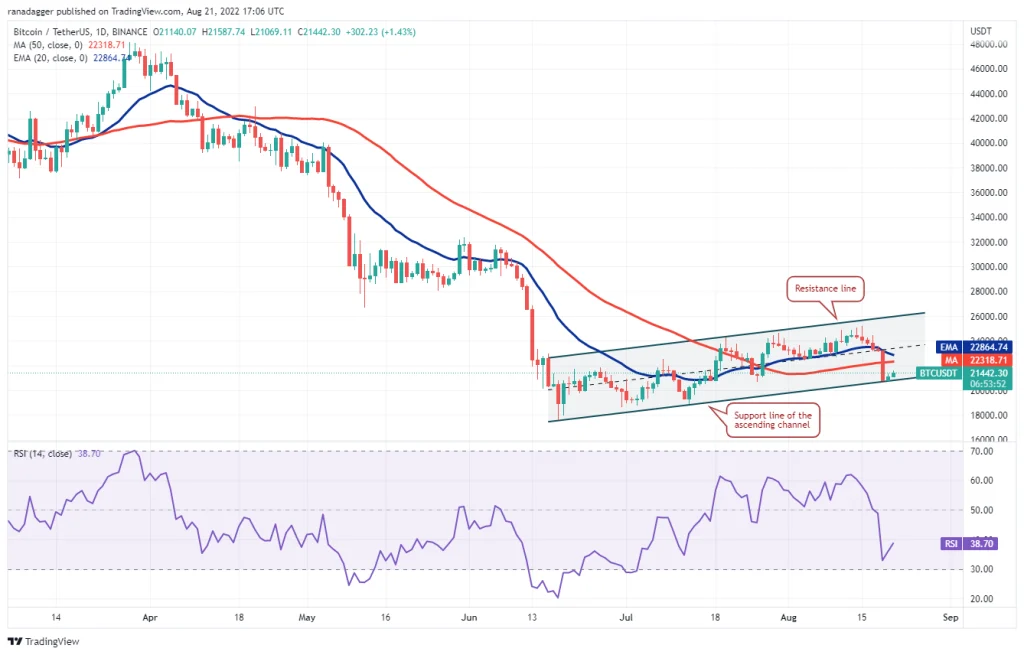
The 20-day exponential moving average has taken a downward slope and the relative strength index is in the negative area, which shows the superiority of market sellers. If the price can move against the moving averages on the chart, it means that part of the traders are selling when the price rises.
This situation can make it more likely that the price will fall below the support of the ascending channel on the chart, and if this happens, the next target for sellers will be to pull the price down to the support area between $18,626 and $17,622.
To avoid this fall, buyers should once again push the price above the moving averages and maintain their position in that area. If they manage to do this, Bitcoin will have the opportunity to grow up to the ceiling of the ascending channel on the chart.
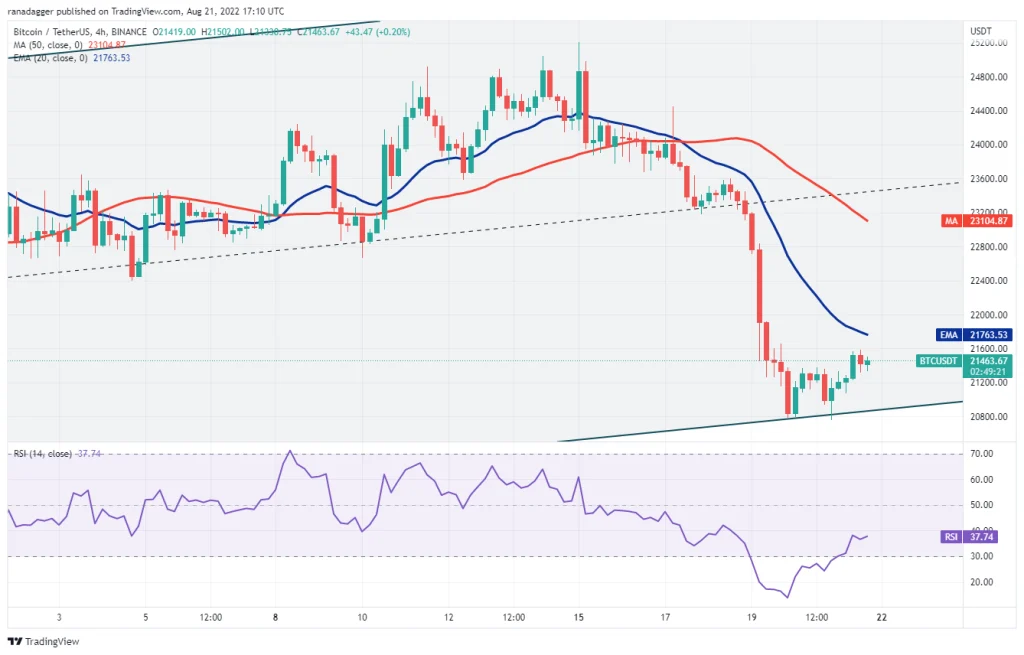
Highly motivated buyers are defending the bottom support of the ascending channel in the 4 candlestick view of the Bitcoin market. However, in this time frame, the downward slope of the moving averages and the placement of the relative strength index in the negative area, indicate that some traders will probably be motivated to sell their assets when the price reaches higher levels.
If the price turns back down from the current levels or after hitting the EMA of 20 candles ($21,763), the probability of breaking the channel floor support will also increase. After that, the price of Bitcoin may drop to the level of $18,626.
The first sign of the beginning of the upward trend will be the return of the price above the moving average of 20 candles. If this happens, it can be said that the downward pressure on the price is decreasing. After that, the way will be opened for Bitcoin to jump up to the 50 candle simple moving average at $23,104.
Binance Coin (BNB)
A few days ago, Binance Coin moved down after hitting the $338 resistance, and buyers continued to strongly prevent the downward trend at the $275 level. This can be a positive sign; Because buyers seem to be looking at lower levels as a good opportunity to enter the market.
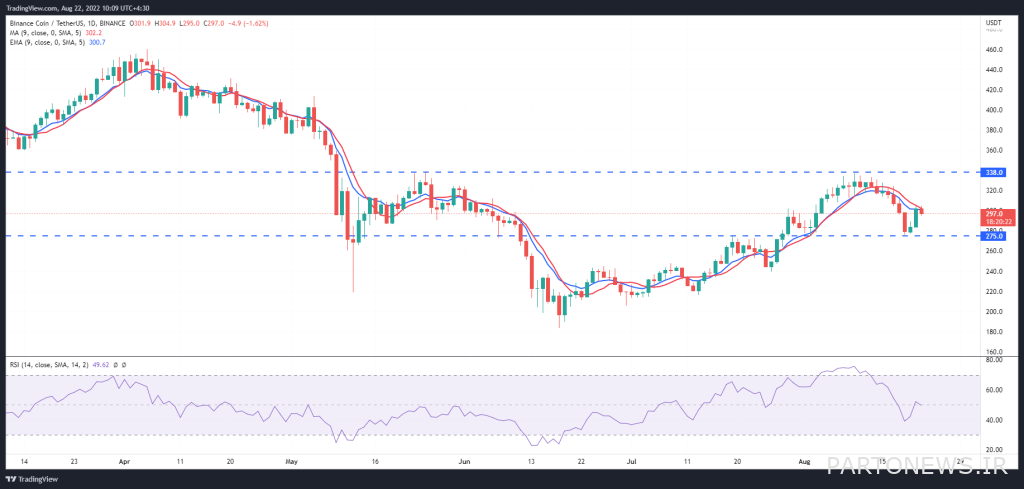
Buyers are facing the resistance of the 20-day moving average at the level of $300 on the path of price recovery. If the price moves lower again after hitting this resistance, sellers will once again try to push Binance Coin below $275. If this support is broken, the price will probably fluctuate between $183 and $338 for a few days.
On the other hand, if the buyers can push the price above the 20-day moving average, the way for the price to return to the level of $338 will be opened. The breaking of the $338 resistance can complete the formation of the inverse (bullish) top pattern on the one-day chart. It should be noted that in this case, the chance of Binance Coin to jump up to $413 and then the target of the pattern will open at $493.
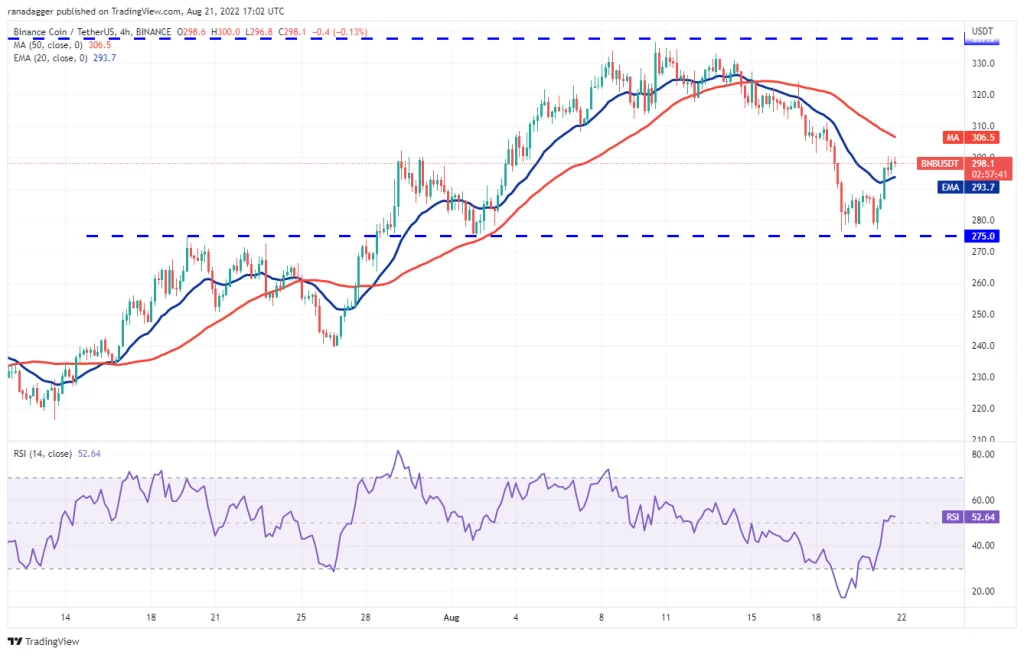
In the 4-hour view of the Binance Coin market, the moving average of 20 candles has taken an upward slope, and the relative strength index is near the middle axis (level 50). If the price candle remains above the EMA of 20 candles, Binance Coin will have a chance to rise to the SMA of 50 candles at $306. The price crossing this resistance can also lead to the continuation of the upward trend up to the level of $338.
On the other hand, if the market continues to decline and the price once again falls below the moving average of 20 candles, the Binance Coin market may experience the level of $275 again. The breaking of this support has led to the completion of the formation of a bearish pattern on the chart, after which the price may fall to $240.
EOS
On the IAS one-day chart, an inverted peak pattern has been formed, which shows the market outlook to a certain extent. On August 17 (26 August), the buyers managed to raise the price above the upper resistance at $1.46; But the long shadow of the candle of that day shows the increase of selling pressure in the market of this digital currency at higher price levels.
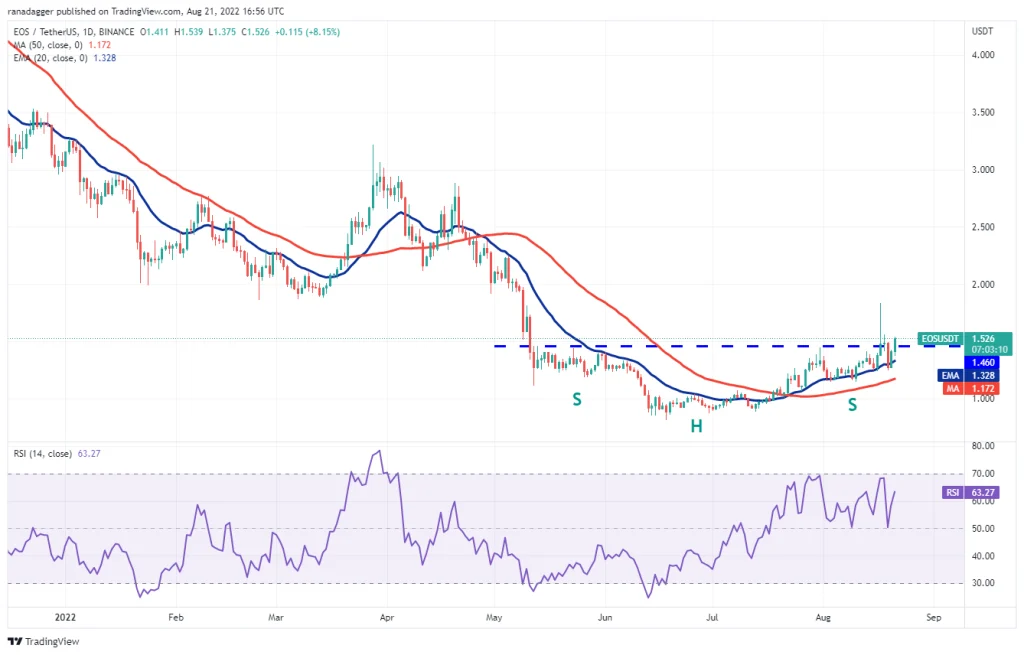
On August 19, sellers brought the price back below the $1.46 level; But the positive point is that buyers have not allowed IAS to fall below the 20-day moving average at $1.32. This means that lows are an attractive buying opportunity for some traders.
If the buyers can keep the price above $1.46, the upward momentum of the price will increase and the way will be opened for the continuation of the upward trend up to $1.83. After that, we can expect the IAS price to jump to the target of the inverted top pattern at $2.11.
It should be noted that if the price falls below $1.24, this bullish outlook will lose its credibility. After that, sellers will try to pull the IAS down to the 50-day simple moving average resistance at $1.17.
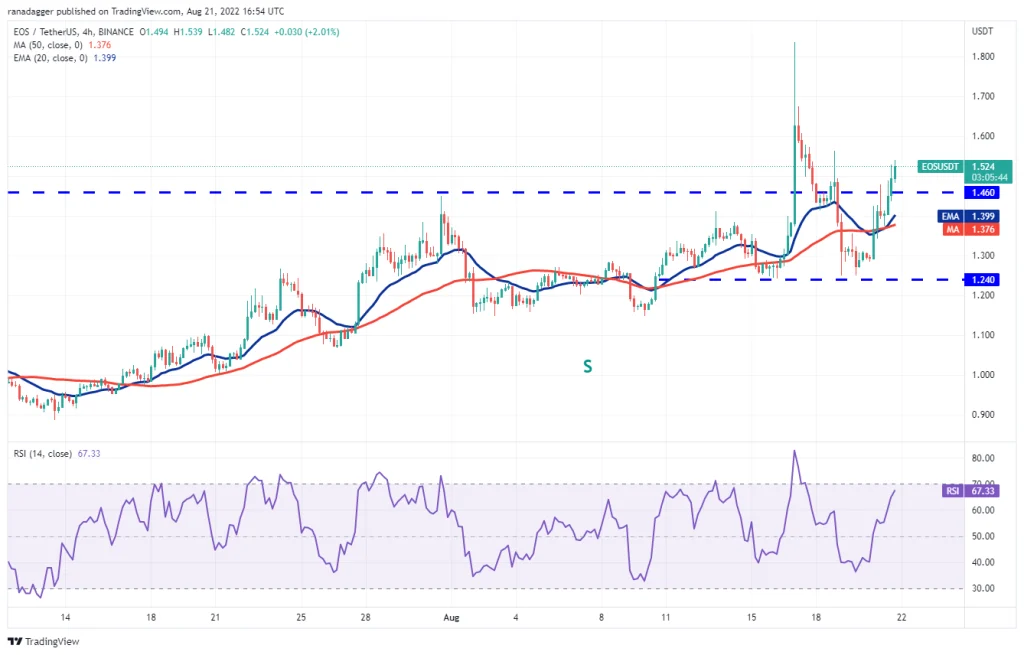
As can be seen from the 4-hour view of the IAS market, the jump in price to $1.46 on August 17 (August 26) has quickly plunged the relative strength index into the oversaturation range. This may have prompted short-term buyers to save their profits and exit the market, possibly driving the price down to the strong $1.24 support; But when the price reached this cross-sectional floor, the buyers bought new units and raised the IAS price to above $1.46 again.
IAS now has an opportunity to rise to $1.56 and then the key resistance at $1.83. Conversely, if the price moves lower from the current levels and breaks below the moving averages on the chart, IAS is likely to fluctuate between $1.24 and $1.46 for the next few days.
QNT
The sequence of highs and lows that can be clearly seen on the one-day chart of Quant indicates the formation of a short-term bullish trend in the market of this digital currency. Buyers have recently started buying near the 50-day simple moving average ($100) and are currently trying to continue the upward movement of the price.
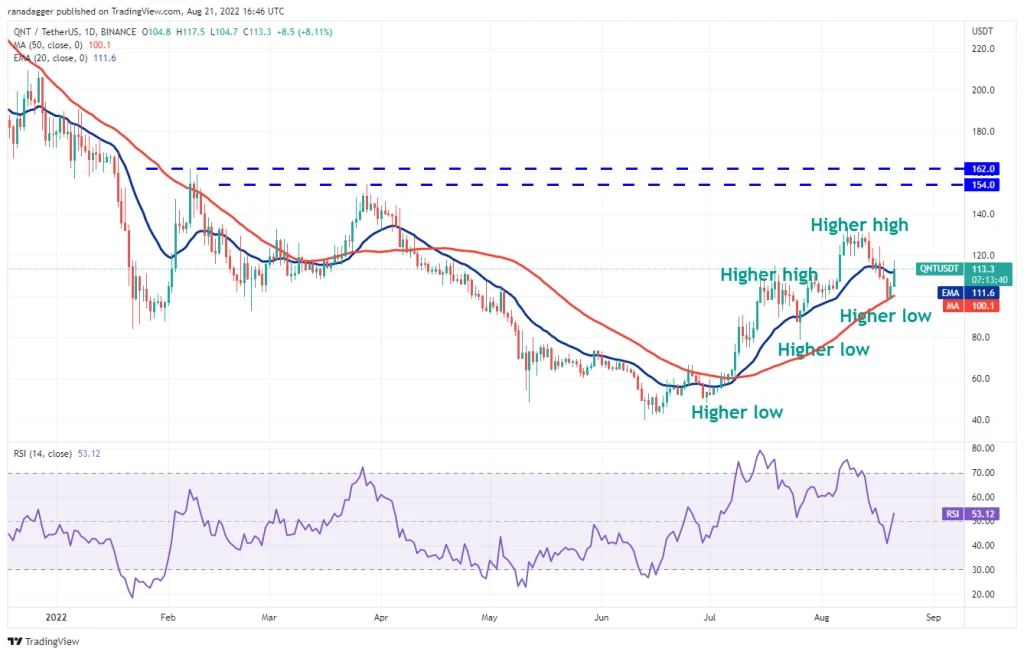
If the quant can maintain its position above the 20-day EMA at $111, it means that the correction of recent days is probably over. The first chance for the quant to rise is the level of $124 and after that it will be the important resistance of $133. If the buyers manage to break through this price barrier, the quant will continue to have the opportunity to grow to the resistance area between $154 and $162.
On the other hand, if the buyers cannot maintain their position above the 20-day moving average, it should be said that probably some of the traders have sold when the price peaked. Sellers need to push the price below $98 to regain control of the market. This may further lead to a deeper price correction to $79.
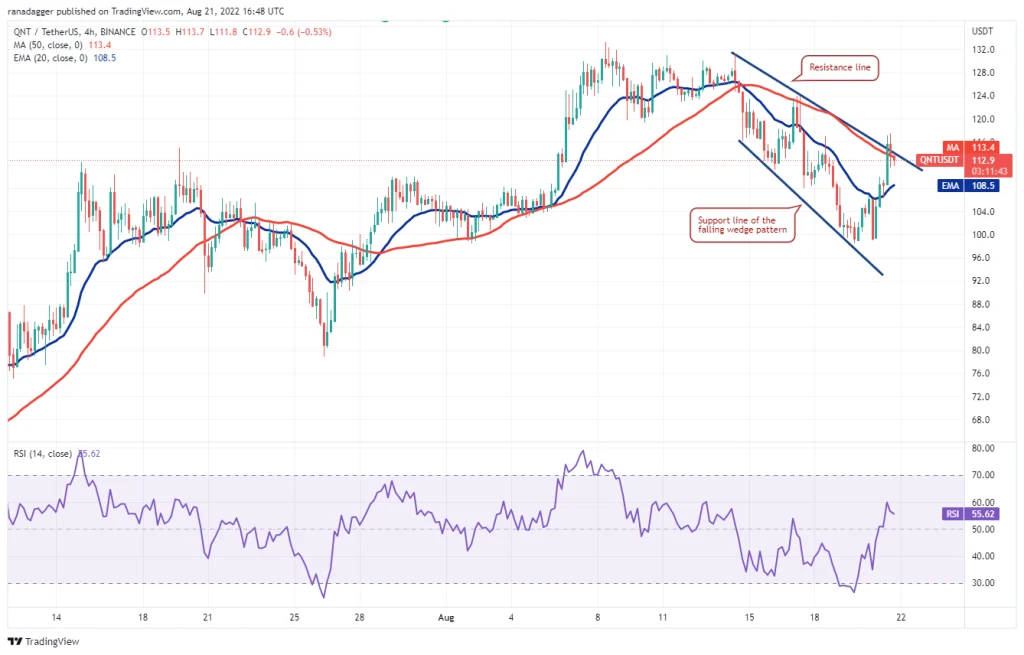
In the 4-hour view of the Quant market, it can be seen that the price has been correcting in the range of the falling corner pattern for some time. Buyers who had recently raised the price above the resistance of the channel ceiling, failed to maintain their position above this level. This shows that sellers become more active as prices rise.
If the price continues to stay below the 50 candle simple moving average, the quant may fall to the 20 candle exponential moving average at $108. This level is particularly important because if the price bounces back higher after hitting it, it means that the short-term market trend has probably changed in favor of buyers.
The passing and closing of the price candle above $188 can also be a confirmation of the end of the correction phase of the quantum market. On the other hand, if the support of the EMA of 20 candles is lost, the $100 level will be the next target for buyers.
Chiles (CHZ)
On August 18 (August 27), the price of chilies increased to 0.23 dollars, and at the same time as the relative strength index jumped, it quickly fell into the overbought zone. This flow may have prompted some short-term traders to take profits and push the price back below $0.20.
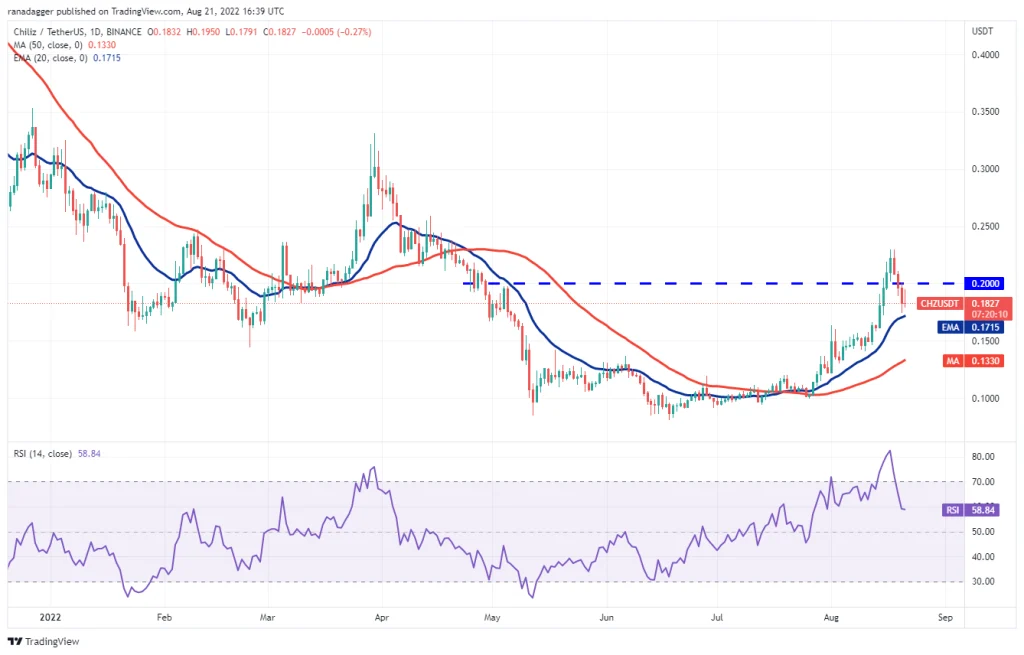
A positive sign is that buyers are still defending the support of the 20-day EMA ($0.17) and are looking to push the price back above $0.20. This means that overall market sentiment remains positive and buyers are more active near price floors. These conditions increase the probability of the price returning to the $0.23 level, and if the buyers manage to cross this resistance, the upward momentum of the price will increase and the way for a jump to $0.26 will be opened.
On the other hand, if Chiles fails to break above $0.20, it means that sellers are increasing their activity as the price rises. If the price falls below the 20-day moving average, sellers will once again take control of the market. After that, the price may go down to the 50-day simple moving average at $0.13.
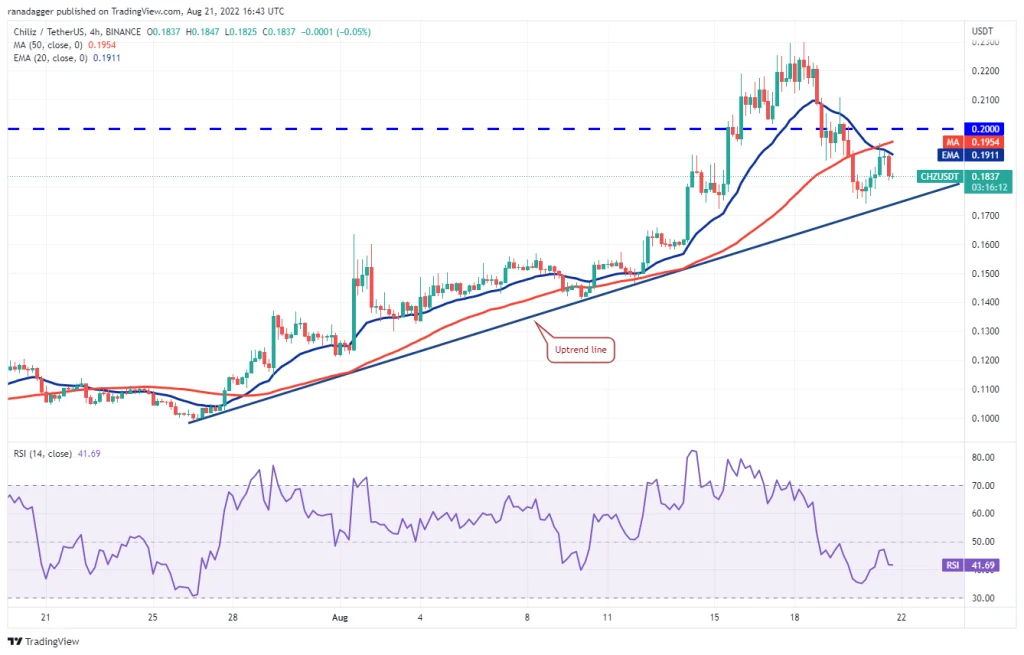
In the 4-hour view of Chiliz market, buyers defend the upward trend line on the chart and face resistance near the moving averages on the chart in the recovery path. These moving averages have recently formed a downward intersection, which coincides with the placement of the relative strength index in the negative area, showing the relative superiority of sellers.
If the price continues to decline and reach below the uptrend line on the chart, the selling pressure will probably intensify and the price will continue to fall to $0.16 and then $0.14. Such a move indicates the continued control of sellers over the market.
On the other hand, if the buyers continue to break through the moving averages, the way will open for the price to reach $0.21 and then $0.23.

