Digital currency price analysis; 5 currencies that you should keep an eye on this week

Bitcoin made a strong upward comeback during the month of July and recorded its best one-month performance since October 2021 (October 1400). The improvement in the market situation of Bitcoin and altcoins brought the “fear and greed” index of digital currencies to 42% on July 30 (August 8), which is the highest level since April 6 (April 17).
Investors seem to be using the current low price levels as an opportunity to buy. As can be seen from the latest on-chain statistics, Bitcoin balance of exchanges In the past month, it fell to 2.4 million units, which has a significant difference with the peak of 3.15 million units in March 2020 (Esfand 98).
Mike McGlone, a senior analyst at Bloomberg, said that a steady increase in U.S. bank interest rates could set the stage for Bitcoin to outperform most other forms of assets. He also said that the risk/reward ratio of Bitcoin has now changed to form one of the biggest bull markets in history.
Having said that, can Bitcoin extend its upward movement in the short term and drag altcoins along with it? To answer this question, we will examine the chart of 5 selected currencies of this week together.
Bitcoin (BTC)
Attempts by Bitcoin buyers to break through the $24,276 resistance over the past two weeks have been unsuccessful, suggesting that sellers are strongly defending this level. On the plus side, buyers haven’t moved too far from this key resistance so far.
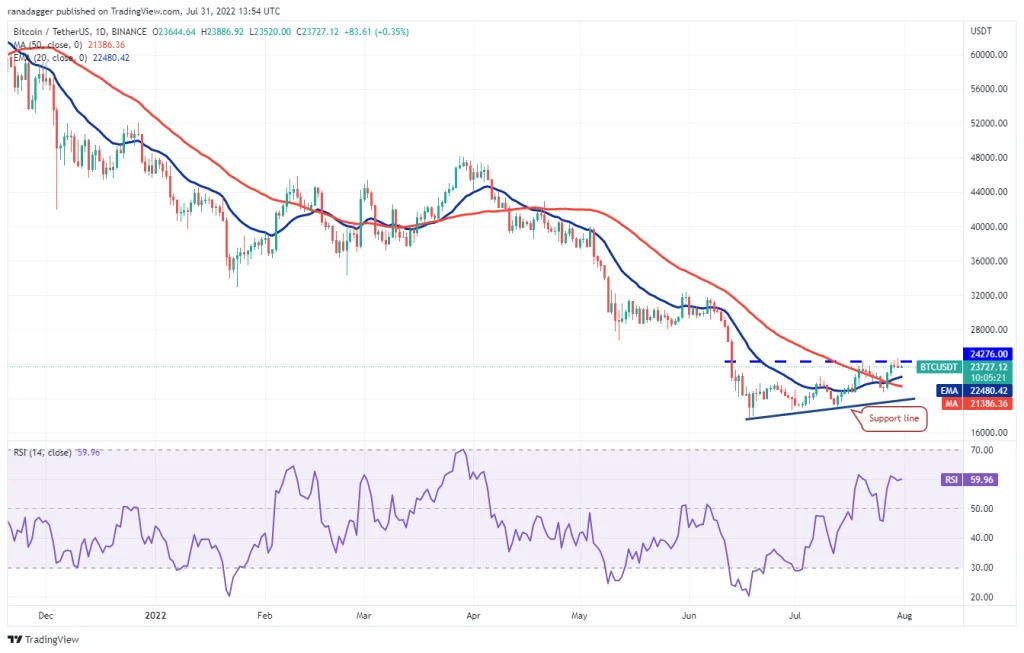
From the current market conditions, it can be concluded that buyers are not in a hurry to save profits (selling) and are still waiting for the price to cross the $24,276 resistance. A candlestick crossing and closing above this level could lead to an increase in the price’s upward momentum and encourage buyers to take Bitcoin to the next resistance at $28,171. Sellers are expected to increase their resistance as the price approaches this range; But if the total force of buyers is more, $32,000 can be the next target of Bitcoin in this upward movement.
The upward slope of the 20-day exponential moving average (EMA 20 – blue line in the picture) and the placement of the relative strength index (RSI) in the positive range (above 50) indicate the relative superiority of buyers.
Conversely, sellers would need to push the price below the 20-day EMA at $22,480 for the bullish outlook to be invalidated. In this case, the way for Bitcoin to fall to the level of the 50-day simple moving average (SMA 50 – red line in the picture) will be opened at $21,386. After that, it is the trend line in the chart above, and if this support is lost, it means that the sellers have once again taken control of the market.
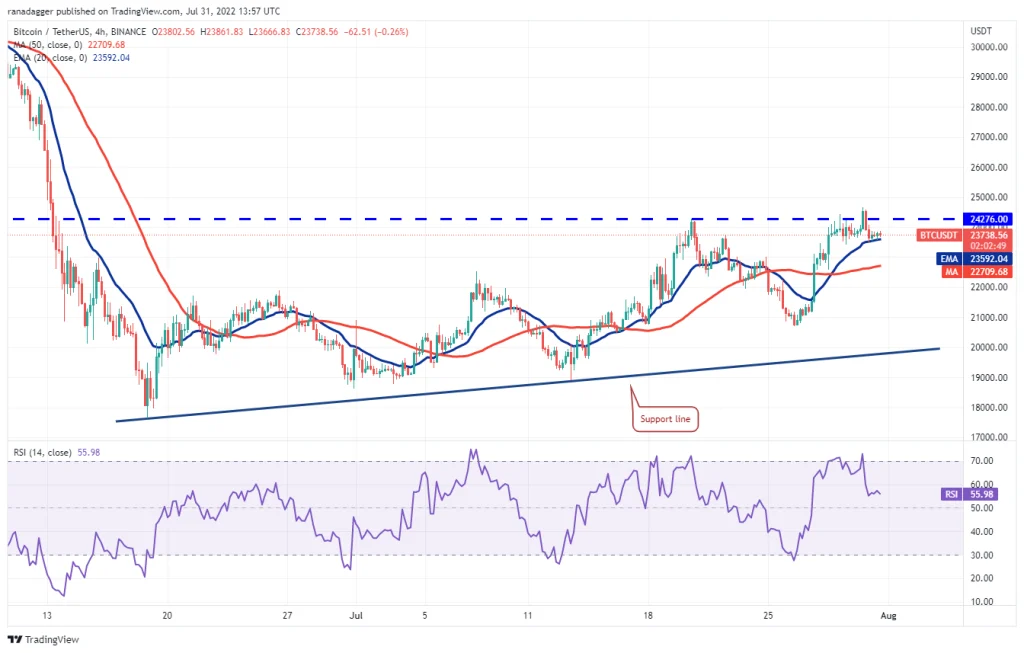
As can be seen from the 4-hour Bitcoin chart, buyers have briefly pushed the price above the $24,276 resistance; But they have not succeeded in using this situation. After bringing the price back below $24,276, sellers are now still trying to break the support of the 20 candle moving average ($23,592). Their inability to break this support thus far could indicate activity by Bitcoin buyers at lower price levels.
If the price bounces back above the current levels, buyers will once again try to break the resistance between $24,276 and $24,668. Crossing this area can help increase Bitcoin’s upward momentum, and against the loss of the support of the 20 candlestick EMA, it will open the way for Bitcoin to fall to the 50 candlestick simple moving average at $22,709.
Binance Coin (BNB)
On July 28 (August 6), the Babins Coin price candle broke the downward trend line in the chart below and this could be a sign of a change in the overall trend of this digital currency. Buyers are currently facing a psychological resistance near $300 to raise the price; But the positive point is that the price has not moved far from this level for now. This means that Binance Coin buyers are also apparently in no rush to save profits.
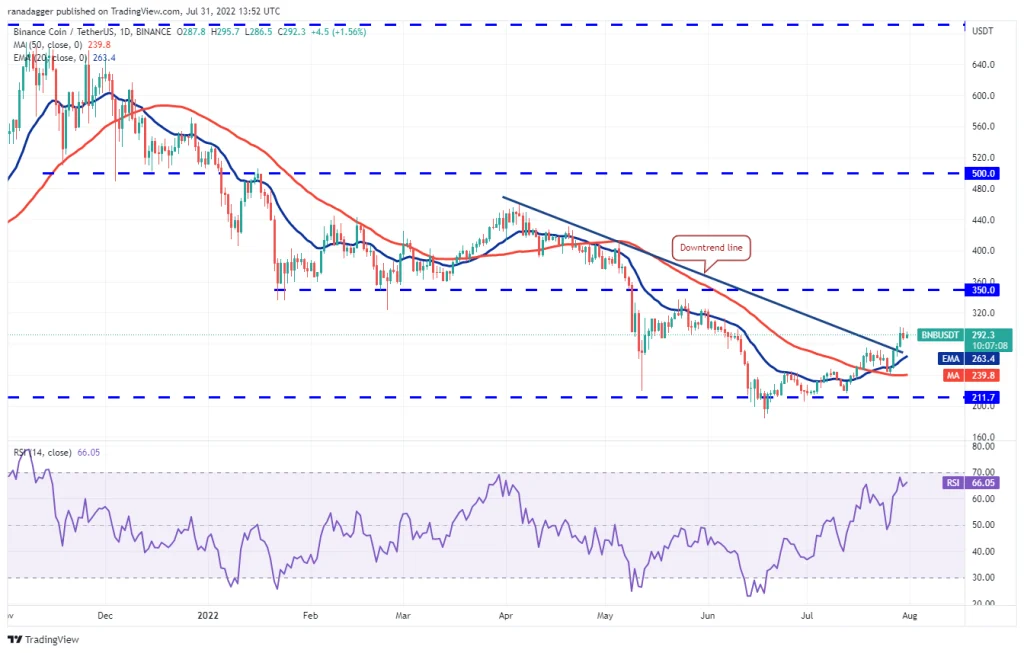
The upward slope of the 20-day moving average and the placement of the relative strength index in the positive area means that buyers are facing little resistance to raise the price. If the resistance of $300 is broken further, the price of Binance Coin can grow until the next resistance at $350.
On the other hand, if the market trend continues to decline and $285 support is lost, the price may return to the downtrend line level on the chart. The 20-day moving average ($263) is not far from this trend line, and therefore we must monitor this range carefully. It should be noted that the breaking of the support of the 20-day EMA may lead to a drop in the price of Binance Coin to the 50-day simple moving average at $239.
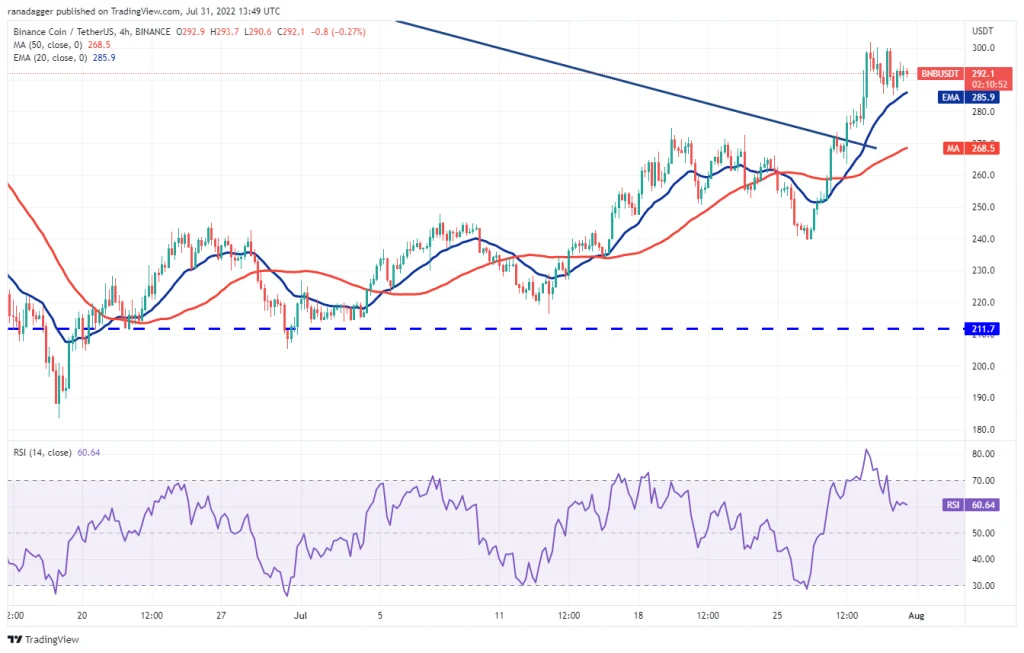
As seen in the 4-hour view of the Binance Coin market, the price has returned to the downside after hitting the $300 resistance and buyers are now trying to hold the support of the 20 candlestick EMA at $285. This issue can indicate increased buying pressure at lower price levels. It is expected that the buyers will try again to cross the psychological resistance of $300 and if they are successful, the upward trend will continue. After that, it is time for the next price resistances at 311 and 322 dollars.
A break of the EMA support of 20 candlesticks can completely invalidate this bullish outlook. In this case, there is a possibility that Binance Coin will fall to the simple moving average of 50 candles at $268, and if the buyers fail to support this level, then it will reach the next support at $239.
Uni Swap (UNI)
On July 26 (August 4), UniSwap moved above the $6.08 breakout level, which shows strong support from buyers at recent price floors. This upward movement met resistance at the $10 level on July 28 (August 6), and sellers are now forming a strong resistance near this level.
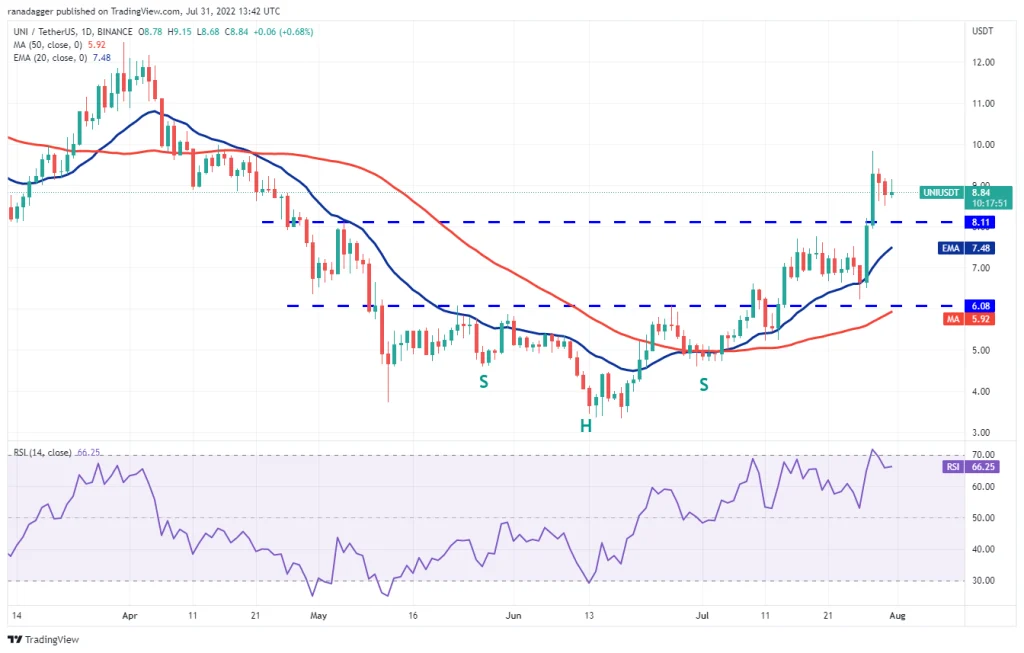
The upward slope of the moving averages and the placement of the relative strength index in the positive area show the superiority of the buyers. If the price continues to bounce back above $8.11, it means that buyers want to turn this level into a new support.
A strong price rebound from the $8.11 level could pave the way for buyers to retest the $10 resistance. Moreover, crossing this level may continue to lead to the start of the next upward wave and increase the price of UniSwap up to $12.
On the other hand, if the price continues to decline and fall below $8.11, UniSwap may drop to the 20-day EMA at $7.48. It should be mentioned that the loss of this support can also be considered as a sign of the weakening of the upward momentum of the price.
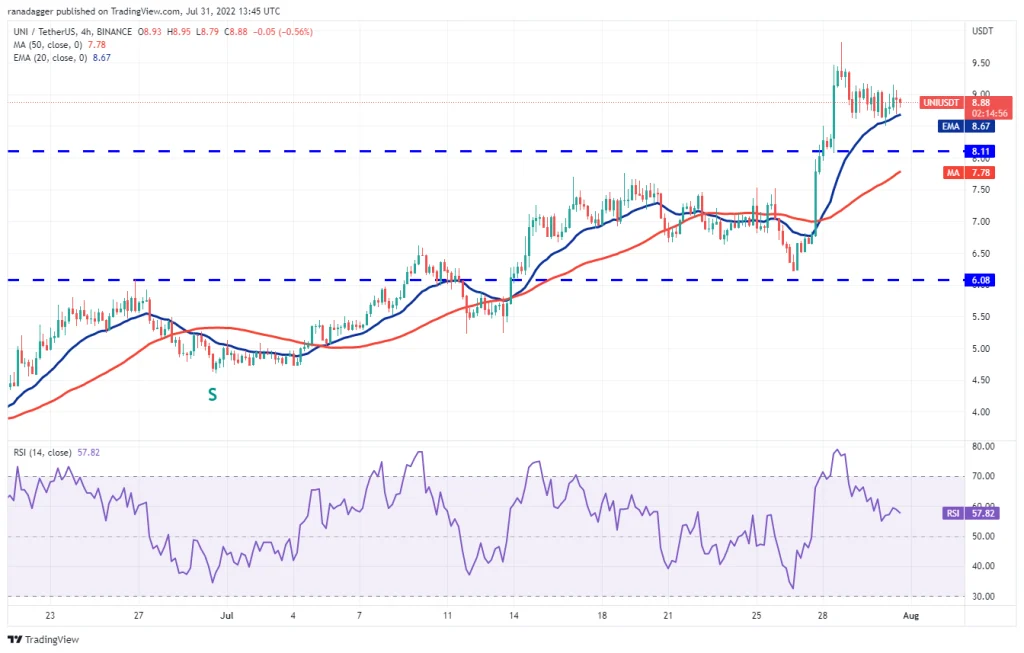
In UniSwap’s 4-hour view, buyers are trying to defend the support of the 20-candleli moving average at $8.67. Now, if the price moves higher from the current levels and the $9.18 resistance is broken, it is time to try to cross the main resistance area between $9.83 and $10.
On the other hand, the price falling below the 20 candlestick exponential moving average can be a sign that supply exceeds demand at this point. In such a situation, It Uniswap may fall to $8.11, and after this, the 50-candlestick simple moving average will fall to $7.78. Maintaining this support is critical for buyers because if the price falls below this level, the short-term price trend will change in favor of sellers.
FileCoin (FIL)
After a few days of fluctuations in a very narrow range, the filecoin price candle formed a significant upward failure on July 30 (August 8), and this event can be a sign of a change in the overall trend of this digital currency. The relative strength index has entered the “saturation of buying” range for some time, and this is another sign for the end of FileCoin’s downward trend.
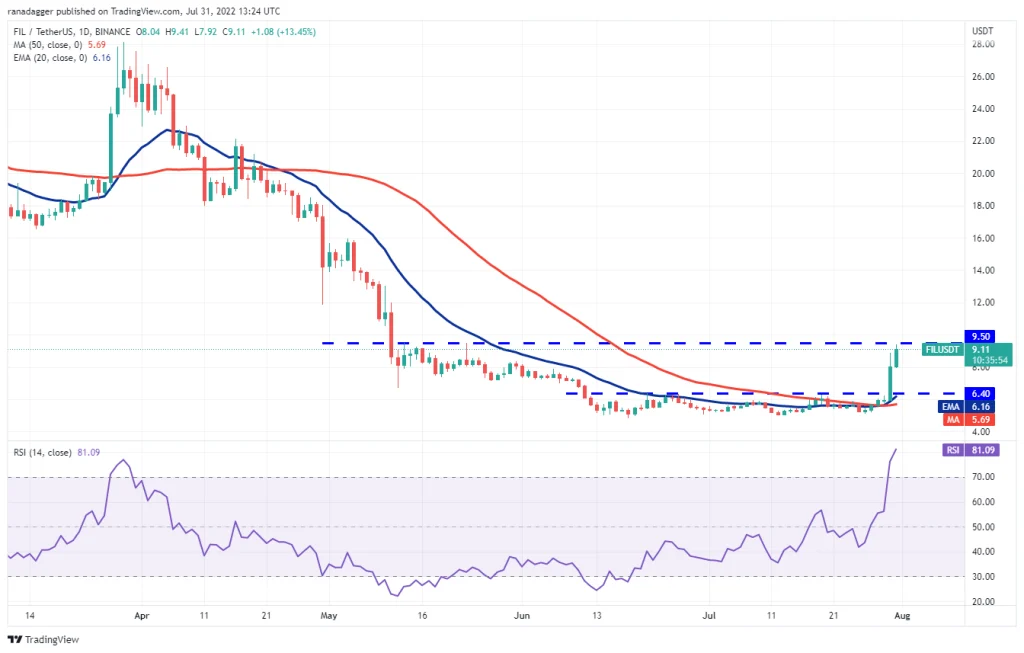
FileCoin may encounter resistance near $9.50 on the way to jump to higher levels; But if the buyers can keep the price close to this area, the chances of filecoin to completely cross this level will increase. In this case, the way will be opened for the price to grow up to 16 dollars. At the same time, this level is also expected to act as a strong resistance.
On the other hand, if the price continues to move lower from the current levels and the $6.50 support is broken, it means that the seller activity has increased as the price approaches the all-time highs. After that, the price is expected to fluctuate between $5 and $9.50 for a few more days.
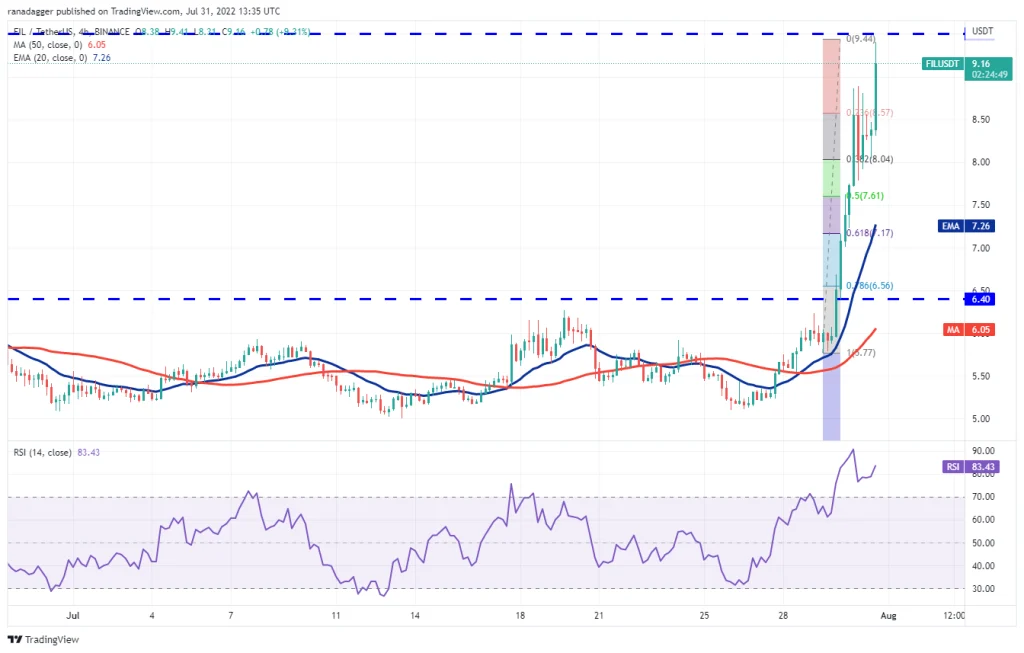
As seen in the 4-hour view of the FileCoin market, the upward momentum of the price has increased after crossing the level of $6.40. Next, the sellers tried to stop the upward trend at the level of $8.89; But buyers supported the price at lower levels, pushing FileCoin to new resistance at $9.50.
Now, if the price moves lower from the current levels, buyers at the 38.2% Fibonacci retracement level ($8.04) are expected to prevent FileCoin from falling deeper. A strong price rebound from this level could further increase the chances of FileCoin breaking the $9.50 resistance, after which the price may continue its upward movement to $10.82. It should be mentioned that the price reaching below 7.70 dollars will invalidate this bullish outlook.
THETA
Theta Network has fluctuated between $1 and $1.55 in the past few days, and buyers’ attempts to cross the resistance of the ceiling of this range on July 30 (August 8) have not reached anywhere.
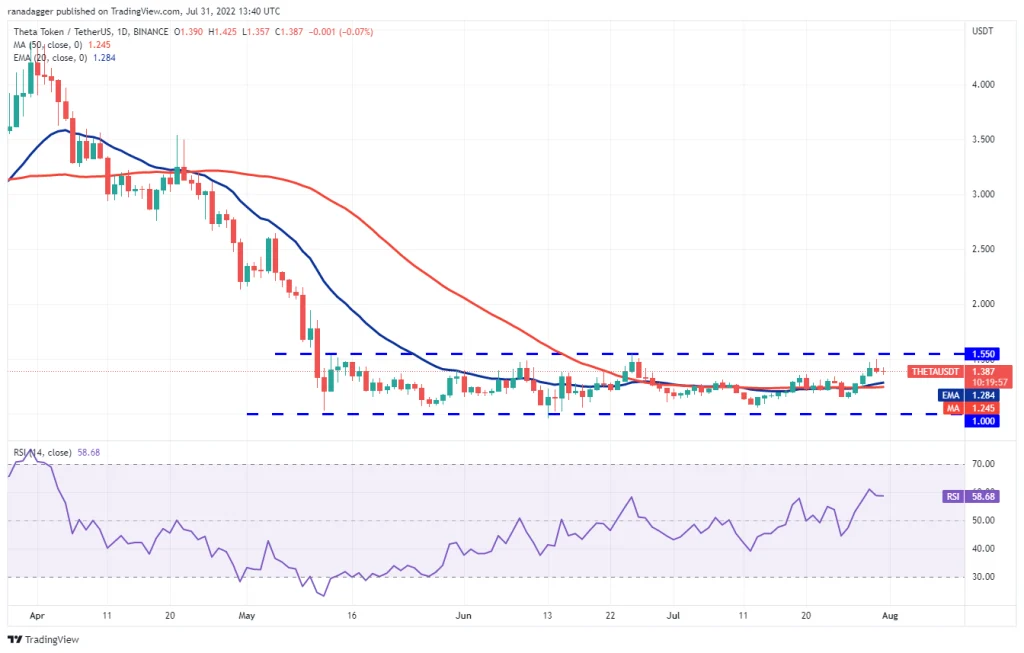
If the price continues to move above the level of the moving averages on the chart, buyers will be encouraged to once again test their chances of breaking through the channel ceiling resistance at $1.55. Their success in doing this can be the spark to start a new upward movement. The possible targets of this new upward move are $2.10 and $2.60, respectively.
Conversely, if the support of the moving averages on the chart is lost, sellers will try to push the price down to the $1 level once again. After that, we should probably see price fluctuations in this range for a few more days.
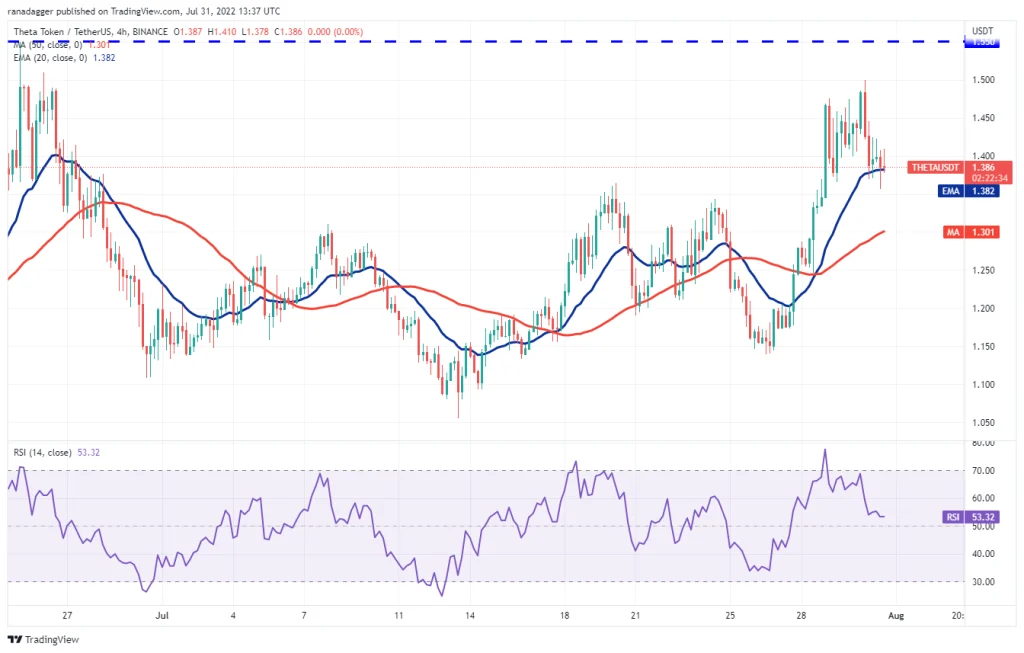
In the 4-hour view of theta market, it can be seen that the price has returned to the bottom after hitting the resistance of $1.50 and is now trying to return to the top near the EMA of 20 candles ($1.382). This condition can show that some traders use every small opportunity to save profit in their trades.
If the price stabilizes below the exponential moving average of 20 candles, the turn will come to the simple moving average of 50 candles. This level is of great importance for buyers, because breaking it can lower the price of Theta to $1.15.
On the other hand, if the price continues to recover strongly from the level of the moving averages on the chart, it means that some traders are buying at the price floors. It should be mentioned that crossing the $1.42 resistance can open the way for the price to jump again to $1.50 and then $1.55.

