Digital currency price analysis; 5 currencies that you should watch this week

Bitcoin price candle in the one-week market view closed for the second time in a row in the upward position and at the highest level since the beginning of 2022. According to in-house data from the analytics platform Golsnood, the recent uptrend in bitcoin has been driven by rising demand in instant markets. This encourages buyers; Because the history of Bitcoin has shown that increasing demand for buying in instant markets leads to continued growth.
Another uptrend for Bitcoin is the growing demand for ProShares Bitcoin Stocks (ETFs) over the past two weeks. Meanwhile, the number of customers of this bitcoin-based fund has recently reached the highest level in its history. Arcane Research says the strengthening of cash flow shows that the willingness to invest in bitcoin is growing through traditional markets.
Other digital currencies, along with bitcoins, are attracting new investors. During the last three weeks of February, venture capitalists invested $ 4 billion in digital currency, according to the Fundstrat Research Institute.
Despite all these issues, can buyers of bitcoins and digital currencies follow the upward trend of recent days? To answer this question, we examine the status of the 5 currency charts, which can perform better in the short term compared to other digital currencies.
Bitcoin (BTC)
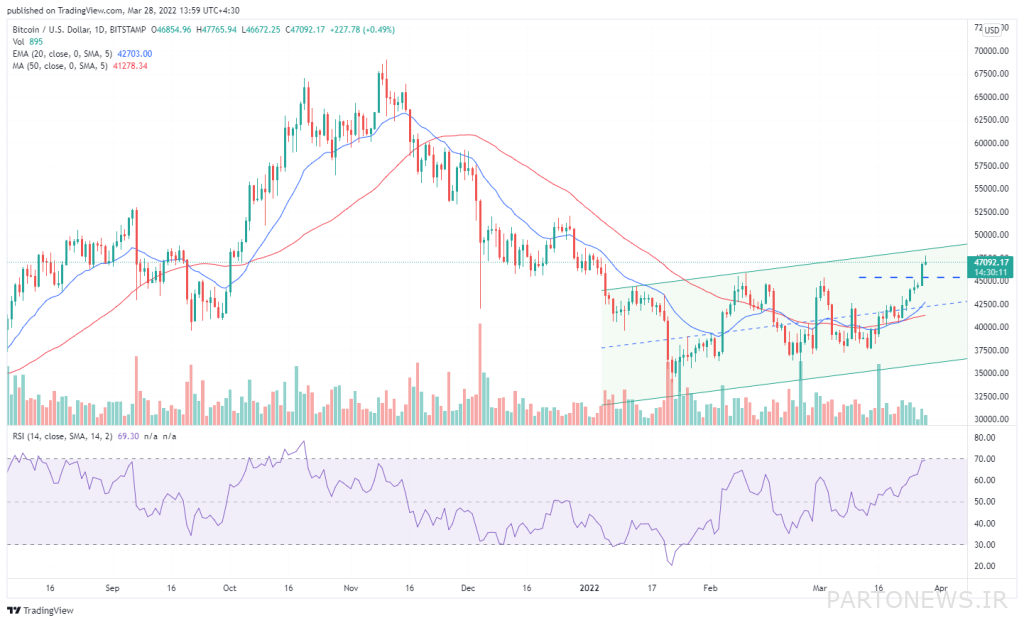
Kendall Long Shadow March 25 (April 5) shows Bitcoin shows that traders have been very active at the level of $ 45,500. The positive thing now is that buyers have not backed down after the recent jumps and are not rushing out of the market.
The 20-day moving average (EMA) slope is quite bullish and the relative strength index (RSI) is in the positive area; A situation that represents the top buyers. Since buyers have now pushed the price above the $ 45,400 resistance, they will continue to face the resistance of the uptrend channel on the chart at $ 47,500.
This level can reappear in the role of an obstacle; But crossing it will pave the way for a bitcoin jump of up to $ 50,000.
On the other hand, if the price continues to fall below $ 45,400 again, sellers will try to lower the bitcoin to the level of $ 42,594. If the market continues to decline, it is necessary to monitor this level; Because a bullish return from this level could once again push Bitcoin above $ 45,400.
In order to say that the market is out of the hands of buyers, sellers must bring the price below the moving averages on the chart.
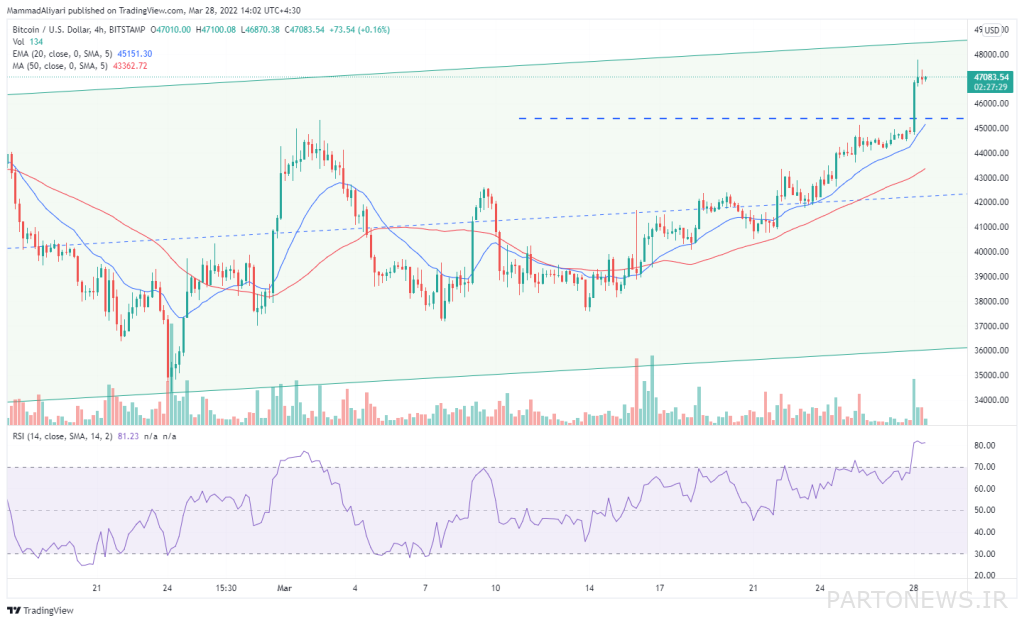
As can be seen from the 4-hour market view, the price has crossed the $ 45,400 resistance and widened its distance with the moving average of 20 candlesticks.
The upward slope of the moving averages and the placement of the relative strength index in the buy saturation zone show that there is not much resistance to bitcoin. A fall below the moving average of 20 candlesticks could dispel this bullish outlook, after which we should expect the price to fall to the level of $ 42,594.
Cardano (ADA)
Cardano has remained above $ 1 over the past few days, indicating that buyers expect the uptrend to continue further and therefore not leave the market.
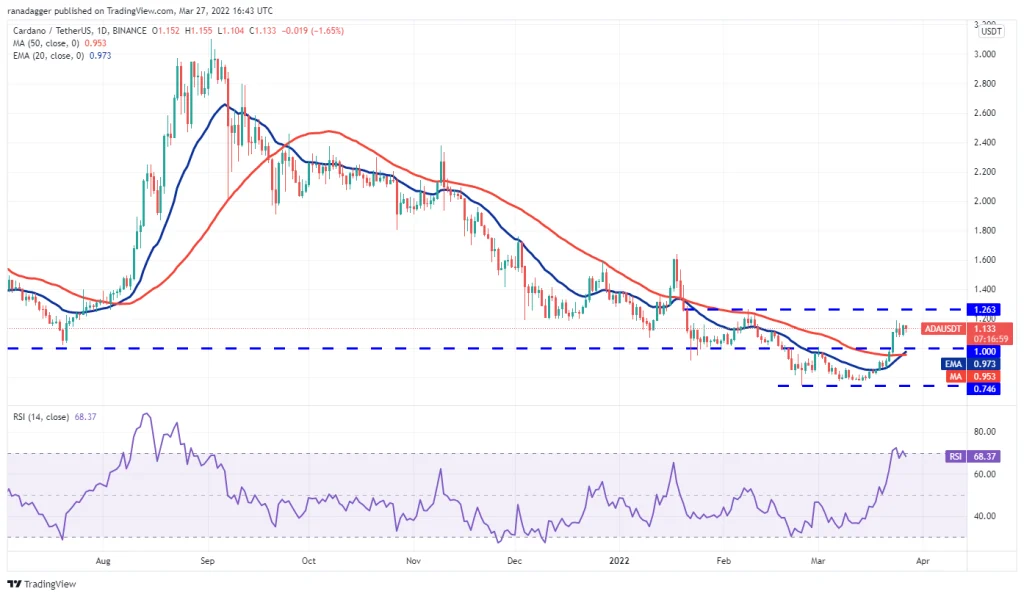
Moving averages have recently formed an uptrend, and the relative strength index is in the saturation zone, which is a sign of buyers’ superiority. If buyers continue to push the price above $ 1.26 and maintain their position at that level, the upward acceleration of the price will increase and Cardano will have a chance to rise to the level of $ 1.60.
On the other hand, if the price returns lower after hitting the $ 1.26 resistance, but the $ 1 support remains intact, it means that Cardano will probably fluctuate in the channel between these two levels in a few days. Even if the sellers lower the price below the moving averages and maintain their position at that level, this bullish outlook will be invalidated.
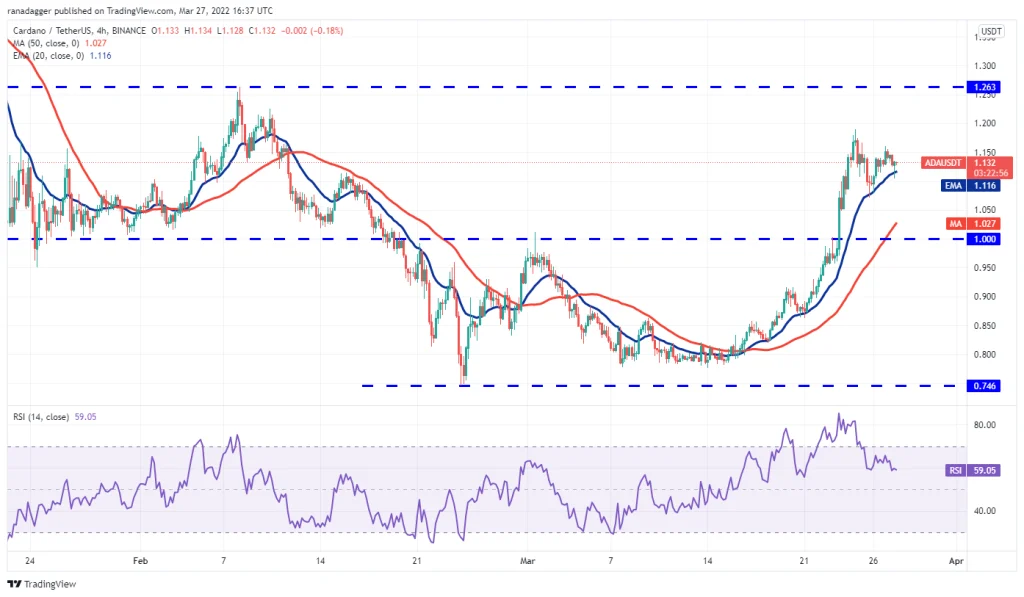
In the 4-hour market view, we see that sellers have already strongly defended the $ 1.20 resistance; But on the other hand, buyers have not allowed the price to remain below the moving averages on the chart. With prices jumping from current levels, buyers will once again try to cross the $ 1.20 and $ 1.26.
On the other hand, if the market continues to decline and the price falls below the moving average of 20 candlesticks, it means that the upward acceleration of the price has weakened. After that, we have to wait for the price to fall to the key support of $ 1.
Oxy Infinity (AXS)
Oxy Infinity has fluctuated between $ 72 and $ 44 in the channel over the past few days. Buyers raised the price to the ceiling of the channel on March 25 (April 5) but failed to maintain their position at this level; An event that confirms the strong resistance of the sellers.
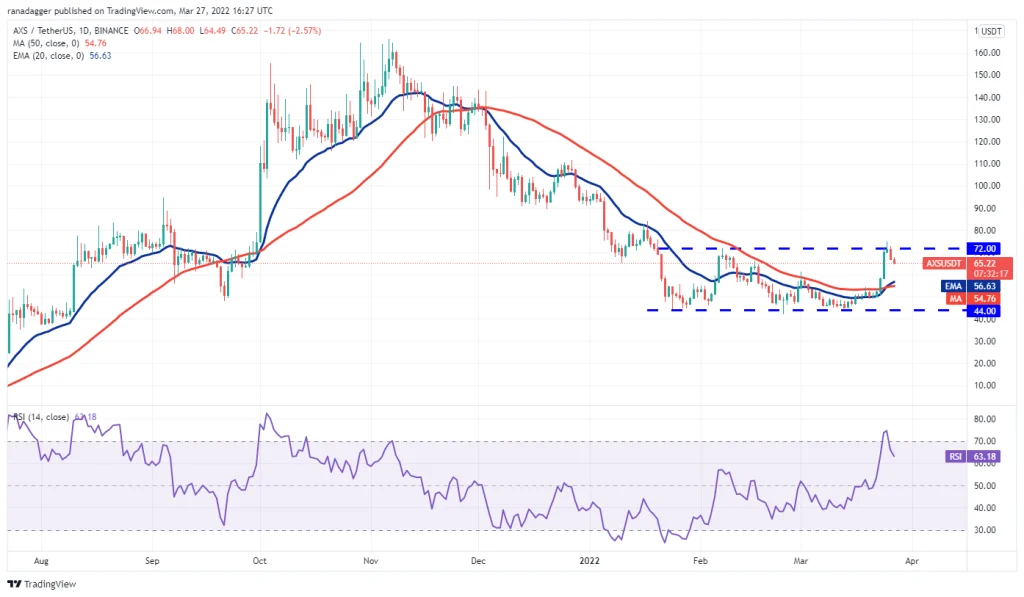
Moving averages on the chart have recently formed an uptrend and the relative strength index is in the positive area, which clearly indicates the superiority of buyers.
If the price continues to move above current levels or after hitting the 20-day moving average, buyers will try to cross the $ 72 level again. If they succeed, the acceleration will increase and Oxy Infinity will have a chance to grow to $ 100.
The credibility of this bullish outlook is lost if the support of the moving average is lost. This can be accompanied by limited price fluctuations in the channel between $ 44 and $ 72 for a few more days.
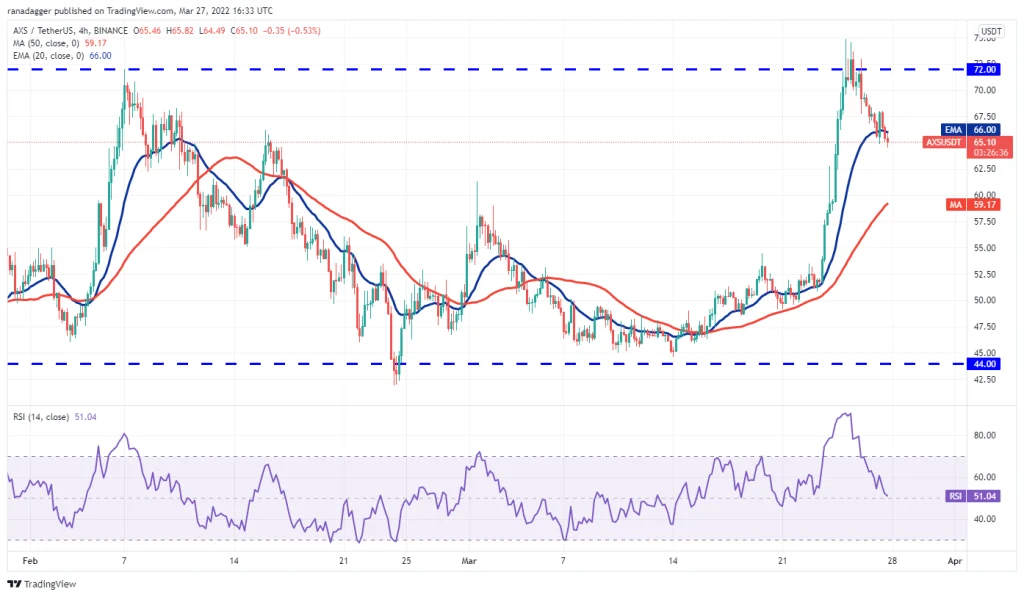
In the four-hour market view, buyers’ unsuccessful attempts to keep the price above $ 72 show that short-term traders may have traded at this level, and therefore the price has reached below the moving average of 20 candlesticks.
If the price of Oxy Infiniti continues to exceed $ 68, it means that the demand for purchase will increase as the price reaches the price floor. Buyers will then try to break the $ 72 barrier and follow the uptrend.
On the other hand, if the price remains below the moving average of 20 candlesticks, the price will be more likely to correct to the simple moving average of 50 candlesticks (red risk on the chart).
China Link (LINK)
China Link has fluctuated between $ 13 and $ 36 over the past few months on a high channel. The sellers had at some point brought the price under the support of this channel; But they failed to maintain their position. This means that the market does not tend to reduce prices further.
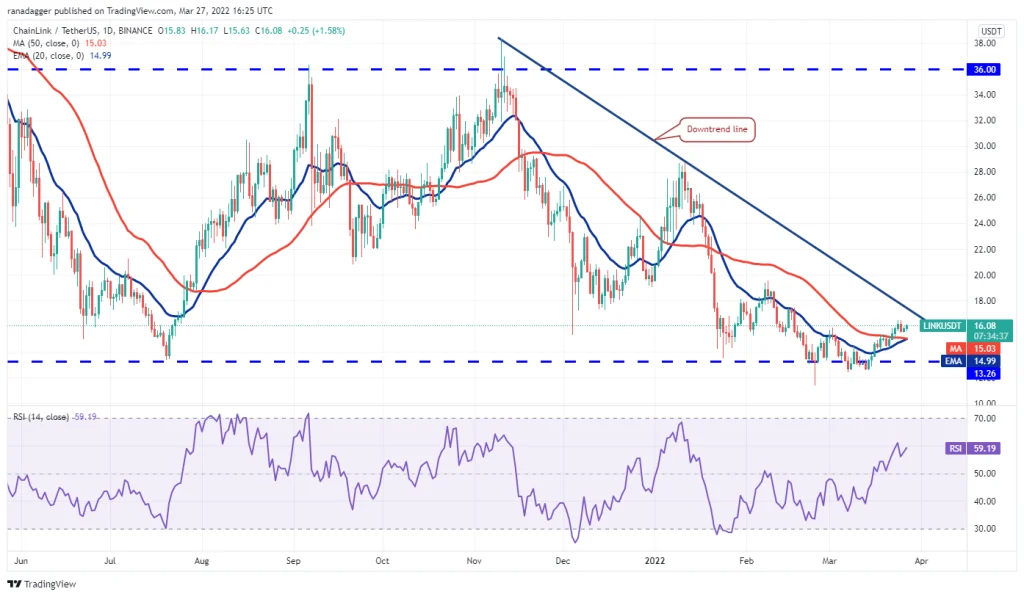
Moving averages on the chart have recently formed an uptrend and the relative strength index is in the positive area, which means that the market is in the hands of buyers. This uptrend may further face resistance from the downtrend line on the chart; But crossing it can be the key to China Link’s leap up to $ 20.
On the other hand, if the price moves down from the current levels, we must first wait for the support of moving averages. If the price rises again after hitting these levels, China Link’s chances of crossing the resistance line on the chart increase; But if sellers push the price below these moving averages, this bullish outlook will be invalidated. This could be followed by the fall of China Link to $ 13.
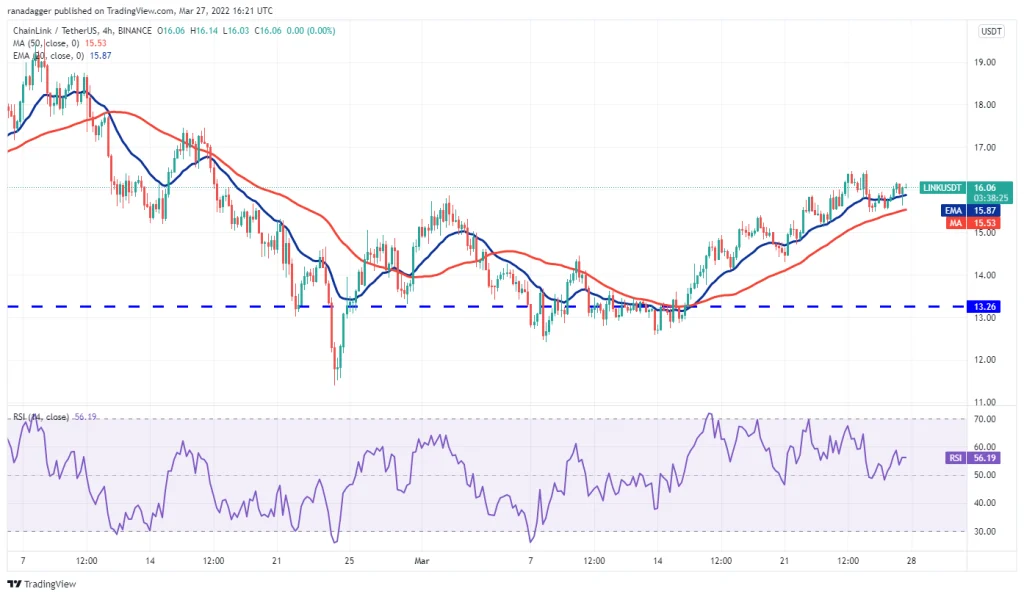
In the four-hour view of China Link market, sellers are showing strong resistance in the range of $ 16.50; But buyers have also maintained their position above moving averages. If the price moves above the current level or after hitting the moving averages and moves away from $ 16.50, we should expect China Link to grow to $ 17.50.
On the other hand, if the price falls below the simple moving average of 50 candlesticks, it means that short-term buyers are out of the market. Subsequent price support is also at $ 15 and $ 14.
FTT
FTT, the FTX digital currency exchange token, crossed a key resistance of $ 49 on March 24, completing the uptrend triangle pattern on the chart. The next day, buyers pushed the price above the $ 50 psychological resistance; But they failed to maintain their position.
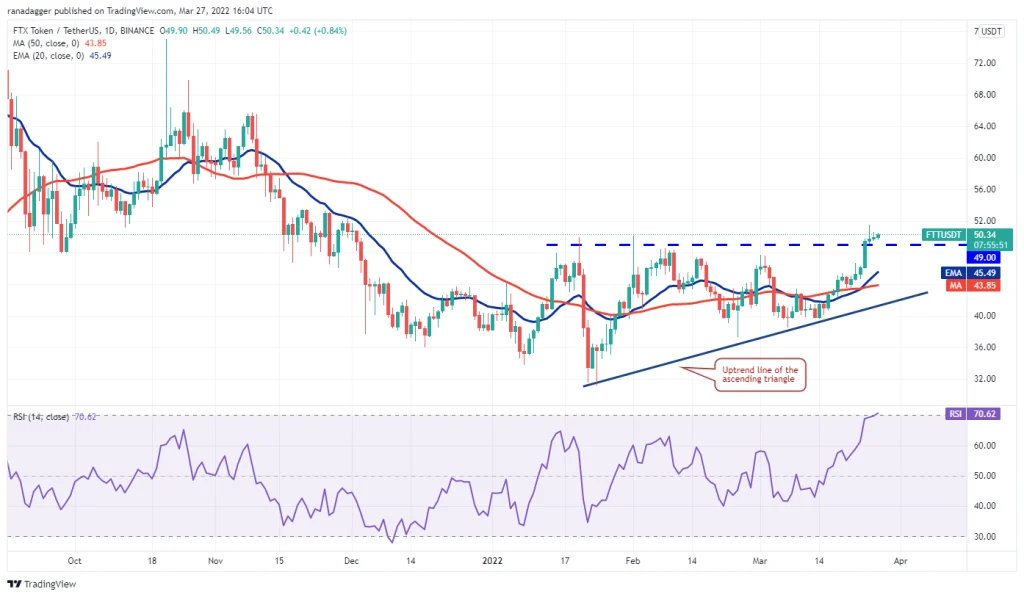
As it turns out, sellers have not yet given up and are still selling at high prices. They are now trying to push the price back below $ 49, and if they succeed, buyers who have entered the market after breaking the resistance of the uptrend triangle will be trapped by sellers. This could push the FTX to the moving average of $ 45.
If the price returns to the upside after dealing with this support, buyers will try again to cross the $ 49 and $ 52 resistances and then follow the uptrend.
On the other hand, falling prices below moving averages mean that sellers have entered the market with strength. Breaking the support of the uptrend line on the chart will also destroy the validity of the triangle pattern. After that, $ 39 acts as price support.
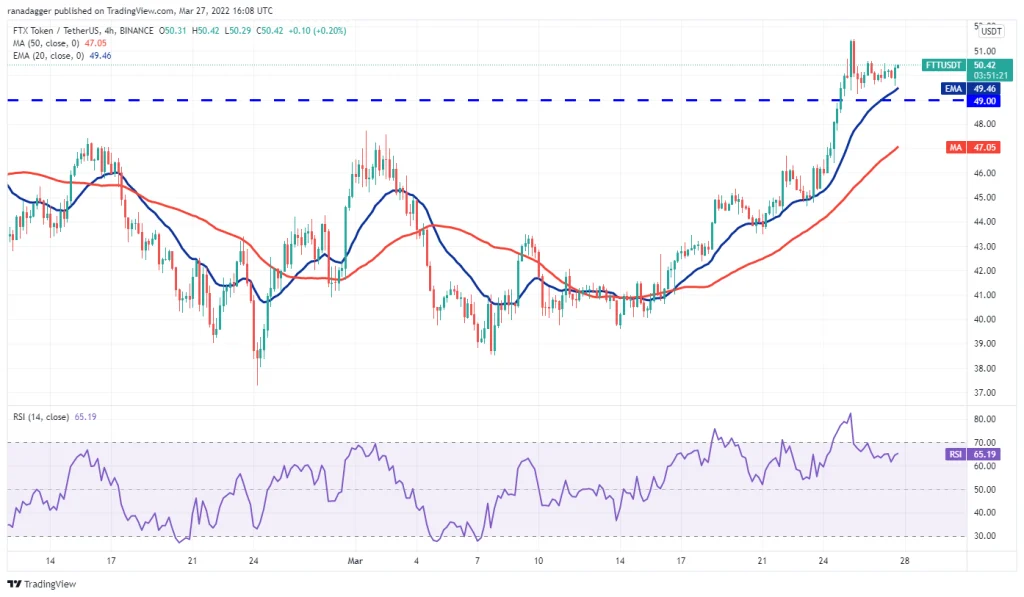
As can be seen from the 4-hour market view, the price crossing above $ 51 has largely pushed the relative strength index into the saturation zone. Such a move is usually accompanied by a sharp correction or stabilization of the price within certain limits. If the market is faced with a correction option and the price falls below $ 49, the downtrend may extend to the simple moving average of 50 candlesticks.
A return from this level will encourage buyers to cross the $ 52 level and resume the uptrend. On the other hand, falling below the simple moving average of 50 candlesticks can be accompanied by an increase in selling pressure and a decrease in price up to $ 45.

