Digital currency price analysis; 5 currencies to watch this week

The bitcoin market has been very calm since the beginning of the week, which indicates that traders do not intend to take any risks before the US Federal Reserve meeting on March 15 and 16 (March 24 and 25). The meeting is expected to determine the rate of increase in US bank interest rates in the coming months, which could have a significant impact on the digital currency market.
The neutrality of the bitcoin price trend in recent days has kept analysts hesitant. The Material Indicators analytics platform recently said that the price of bitcoin is likely to fall again; But he advised traders to shop on the price floor, as the re-jump of bitcoins could “change their fate.”
Can digital currencies start a definite direction in the near future? To answer this question, we will examine the situation of the 5-currency chart, which can further start a new uptrend by improving the feelings of traders.
Bitcoin (BTC)
On March 12 and 13 (March 21 and 22), the 1-day view of the Bitcoin Kendall Dodge market was formed, which shows that both buyers and sellers of the market are undecided. The price is currently caught between the 20-day moving average (EMA) and the $ 37,000 support.
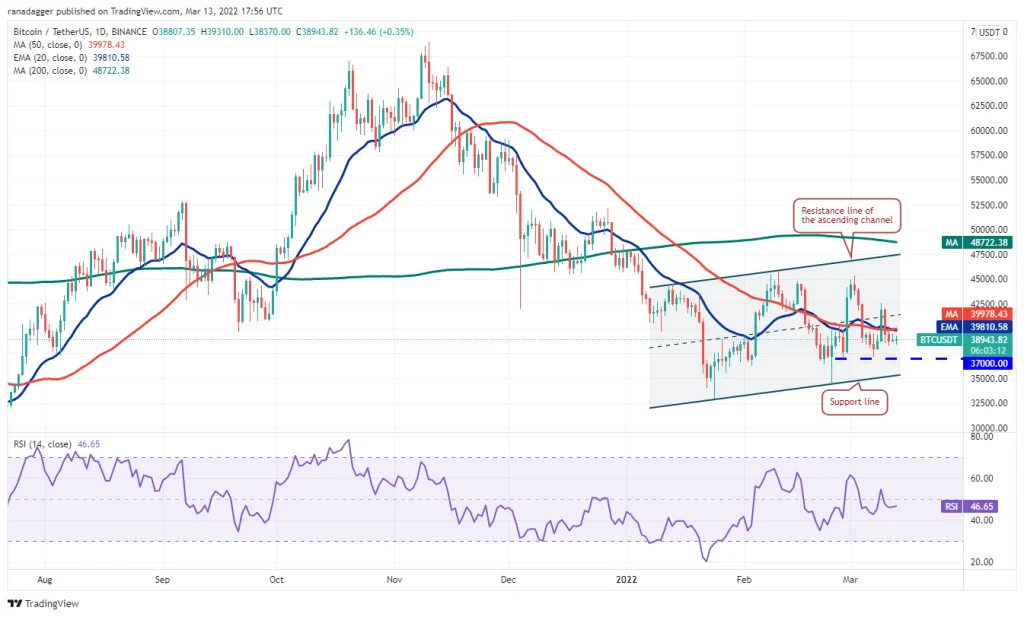
The slope of the 20-day moving average is neutral and the Relative Strength Index (RSI) is below the center axis (level 50), which indicates the balance between supply and demand in the Bitcoin market.
If the price continues to rise above the 20-day moving average at $ 39,978, then buyers will try to push the price above $ 42,600. If they succeed, Bitcoin will have a chance to grow to $ 45,400 resistance and then channel resistance.
On the other hand, if the price continues to fall and falls below the $ 37,000 support, market sellers will have the opportunity to bring the price below the support of the bullish channel on the chart. If they do, bitcoin is more likely to fall to the $ 30,000 level.
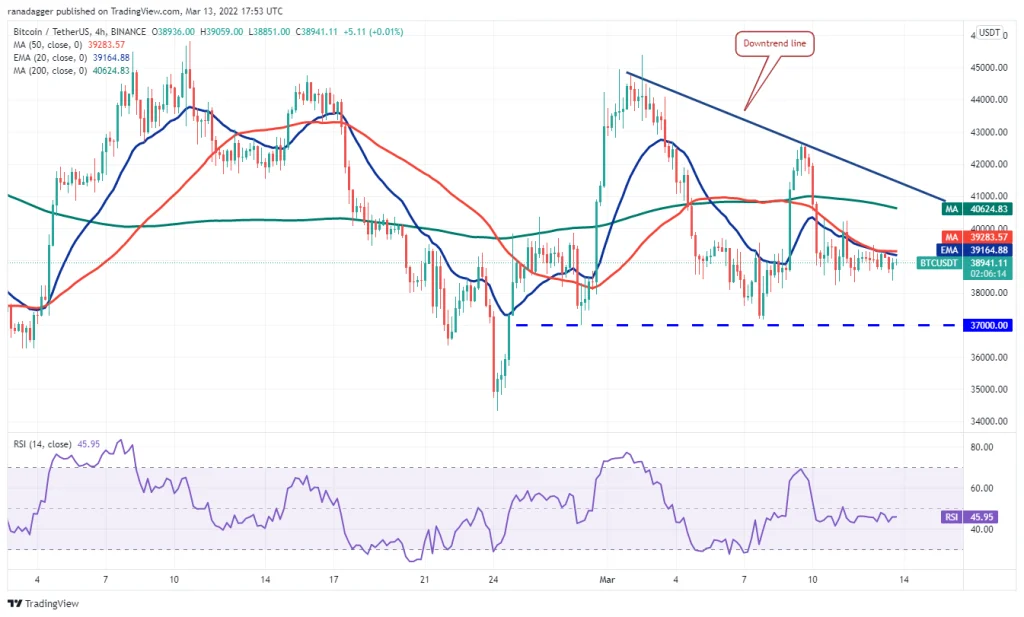
In the 4-hour view of the Bitcoin market, the price is forming a downward triangle pattern, which will be completed by breaking the $ 37,000 support and closing the price candle below this level. In that case, we would have to wait for the bitcoin to fall to the $ 34,322 support, after which the sellers will try to get the bitcoin to the target of this downtrend at $ 29,250.
On the other hand, if buyers can push the price above the 50 Kendall Simple Moving Average (SMA) and stabilize their position there, Bitcoin will have a chance to grow as long as the downtrend resistance on the chart grows. Breaking the resistance of this trend line can nullify this bearish outlook; A move that excites buyers and paves the way for a bitcoin jump to $ 45,400.
Also read: What is an RSI and How Do We Use It in Technical Analysis?
Polkadat (DOT)
The price of Polkadat has been on a downward trend for several months, however, buyers are trying to stabilize the price floor between $ 16 and $ 14. The price has recently reached above the 20-day moving average; But buyers’ attempts to cross the simple 50-day moving average have so far been unsuccessful.
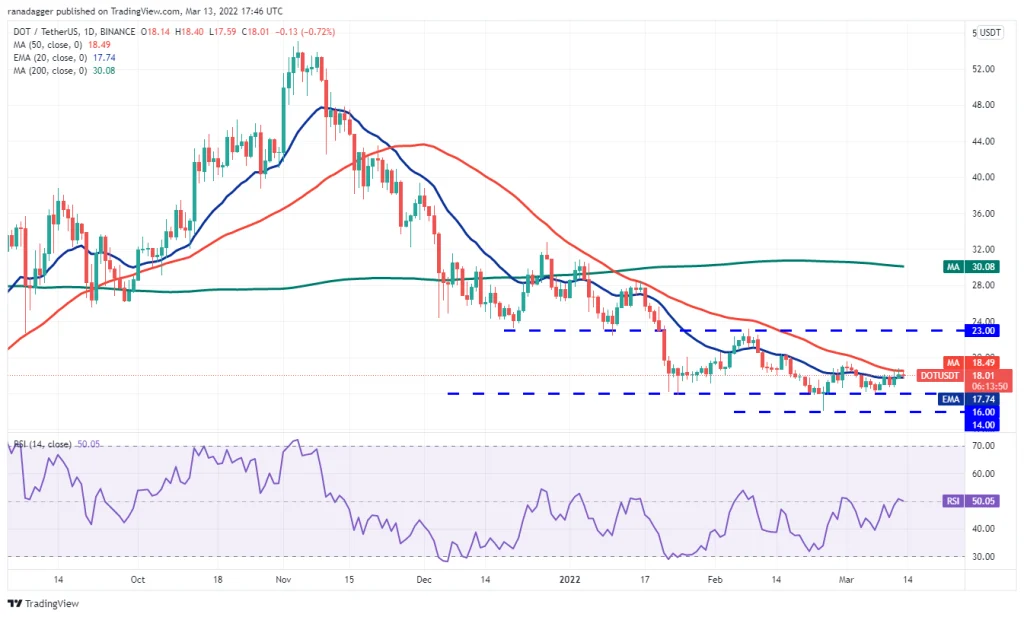
The positive sign seen in the Pulkadat market is that buyers are not far from the simple 50-day moving average; This means that they can maintain their market dominance by overcoming the resistance of this moving average. In that case, Polkadat will have a chance to grow to $ 23 resistance; The level at which sellers are likely to reactivate when the price reaches that level.
The neutralization of the 20-day moving average slope and the relative strength of the index near the mid-axis indicate that price fluctuations are likely to continue at certain intervals. If the price falls below the levels of a simple 50-day moving average, sellers will try to bring the Pulkadat to $ 16 support. Their success in breaking this level could push the price down to the next key support at $ 12.
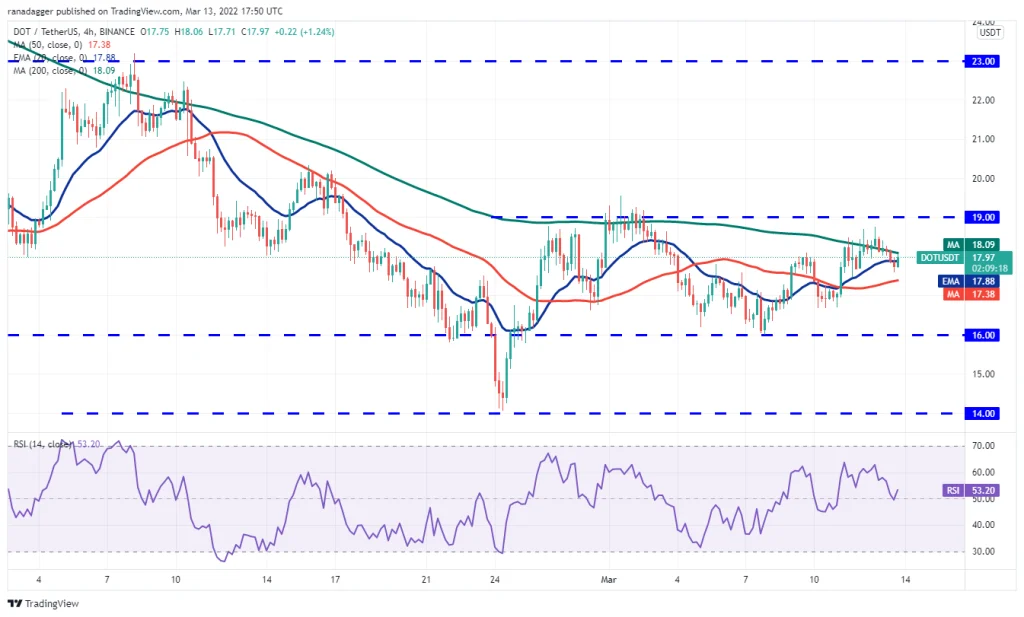
As can be seen from the 4-hour market view, the price on the channel fluctuates between $ 16 and $ 19. Buyers’ unsuccessful attempts to push prices above the channel’s resistance may have prompted short-term and volatile traders to exit the market; This partly justifies the Pulkadat crash near the simple moving average of 50 candlesticks.
If Polkadat can continue to rise above the simple moving average of 200 candlesticks, it means that traders will continue to buy when the price reaches the price floor. Buyers will then try to push the price above the $ 19 resistance, and if they succeed, Pulkadat will have a chance to rise to $ 20 and then $ 23.
On the other hand, falling prices and breaking the support of the simple moving average of 50 candlesticks could increase the probability of a fall of the Pulkadat to the key support of $ 16.
Sandbox (SAND)
The sandbox has been hovering between $ 2.55 and $ 4.86 for the past few weeks. Sellers have recently pushed prices below the 200-day moving average at $ 3.15; But as the chart shows, they have failed to break the $ 2.55 support.
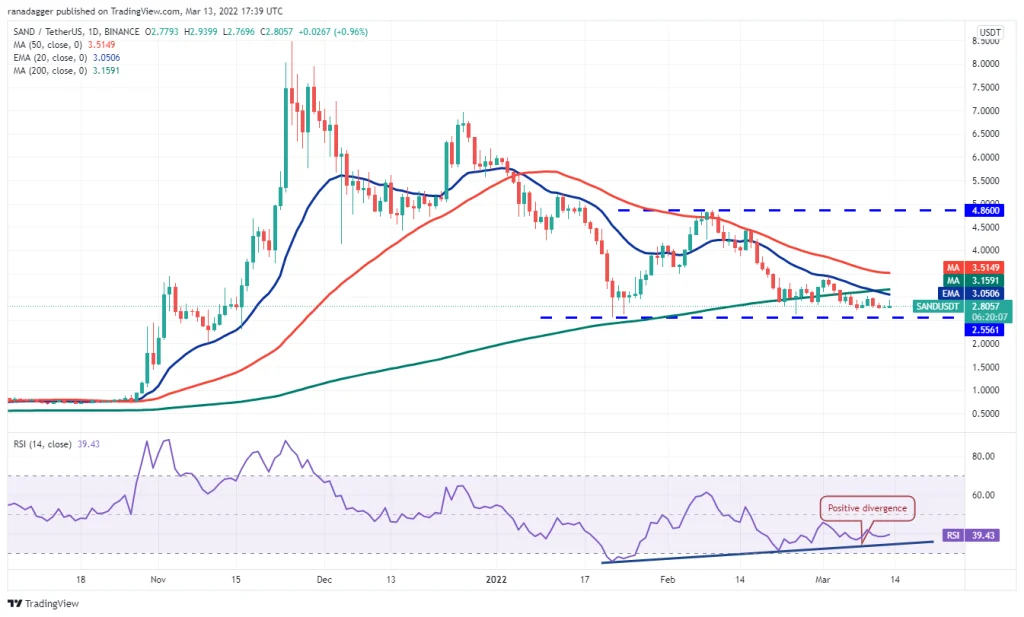
Remaining high price of canal floor support shows that buyers have become more active in this area. The relative strength index shows signs of positive divergence, which could mean a weak price downtrend.
If the price starts to rise from the current levels, buyers will try to push the price above the simple 200-day moving average. If they successfully complete the move, the sandbox will have a chance to rise to a simple 50-day moving average at $ 3.51. Crossing and closing the candle will open the way for the high price of this sandbox to jump to the levels of $ 4.50 and $ 4.86.
On the other hand, if the price continues to fall below $ 2.55, the credibility of this bullish outlook will be lost; A move that would mean a resumption of the previous downtrend.
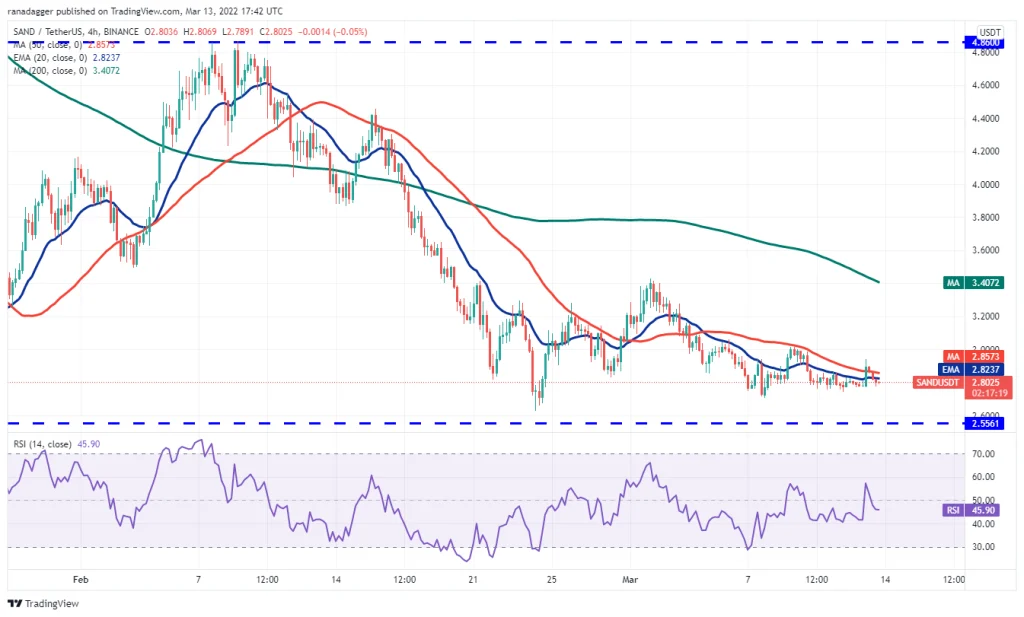
In the 4-hour view of the sandbox market, the simple moving average of 50 candlesticks acts as a strong resistance. If sellers can bring the price below $ 2.70, the price will probably fall to $ 2.55 support. Breaking this support can be a sign of sellers’ superiority.
To escape this fall, buyers must push the price above the area between the simple moving average of 50 candlesticks and $ 3. In that case, the sandbox could rise to $ 3.42, and once that level is reached, sellers are likely to resist again.
Thor China (RUNE)
On March 1, the Chinese Taurus broke the resistance of the 50-day moving average and the 20-day moving average, and on March 8, it was able to maintain its position above these levels after the price fell; This shows that traders’ feelings have changed from “peak sales” to “bottom-line purchases”.
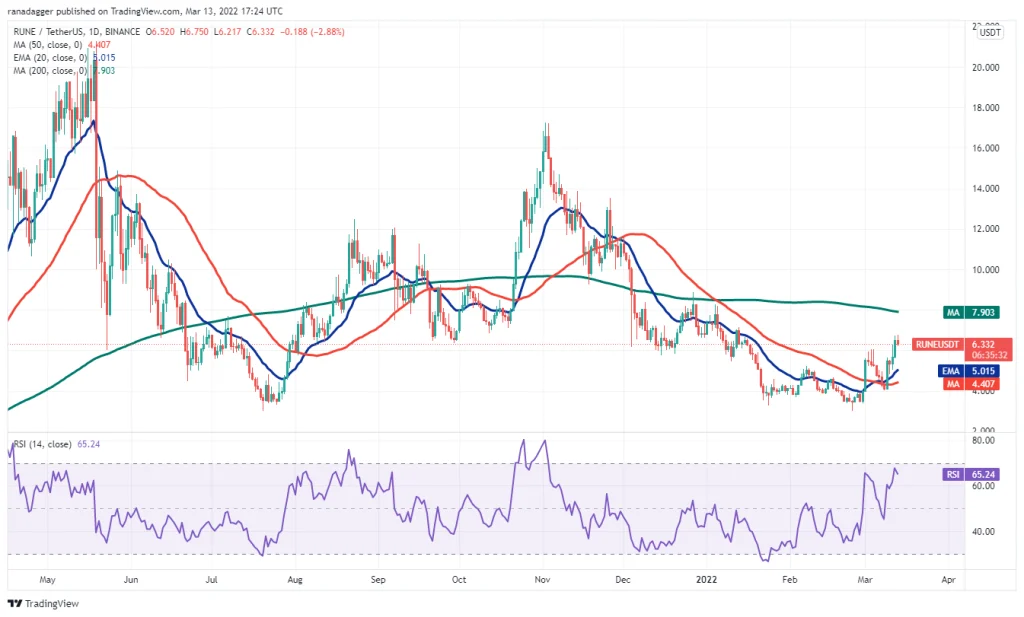
Buyers are currently trying to bring the price closer to the simple 200-day moving average at $ 7.90; An area where vendors will be more active. If the price does not continue to fall and does not fall far short of the simple 200-day moving average, buyers will try to cross this level once again. In that case, Thor China will have a chance to rise to the level of $ 9.
On the other hand, if the price moves down from the current levels, the 20-day moving average will be an important support that we should monitor; Because if the price goes up again after hitting it, it means that the traders’ bullish sentiment remains intact, and on the other hand, if this support is lost, we will have to wait for the price to fall to the level of $ 4.
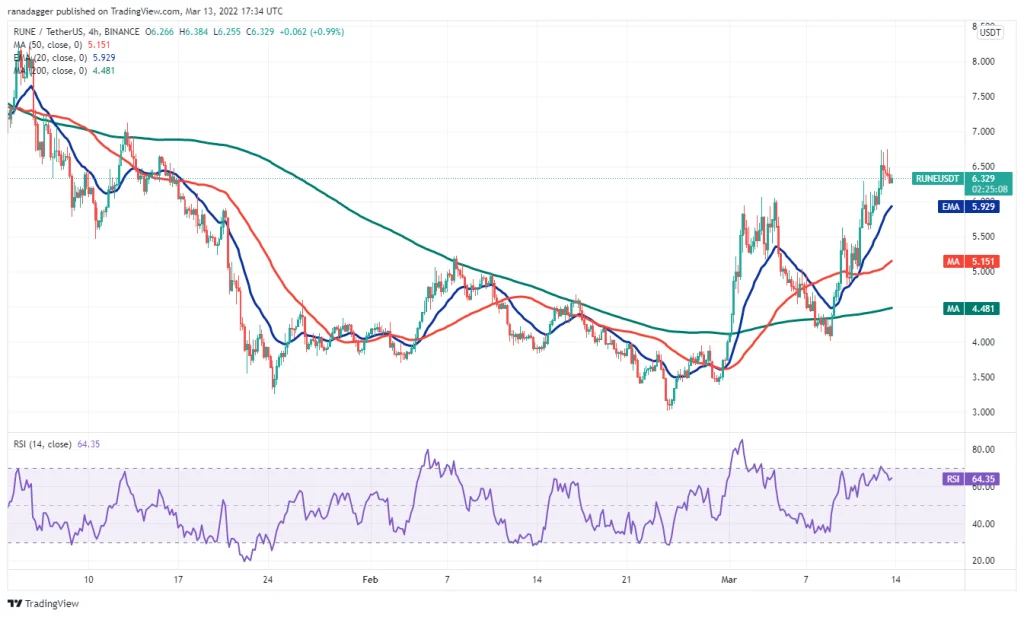
In the 4-hour chart of China’s Thor market, the moving average of 20 condensers has an upward slope and the relative strength index is in the positive area, indicating that more control of the market is in the hands of buyers. The price now has a chance to rise to the level of $ 7 and will probably face resistance from sellers in this area.
On the other hand, if the price falls below current levels, the moving average of 20 candlesticks will act as support for the Thor Chinese. The return of prices after falling to this moving average means that buyers do not want this uptrend to end so soon. Breaking the support of the 20-day moving average can be a sign of a change in the short-term price trend.
ZEC
On March 8, the price of Ziksh crossed the $ 135 resistance and the twin floor pattern on the chart was completed. The move was followed by the price crossing the simple 200-day moving average at $ 145, which is a sign that buyers are returning to the stock market.
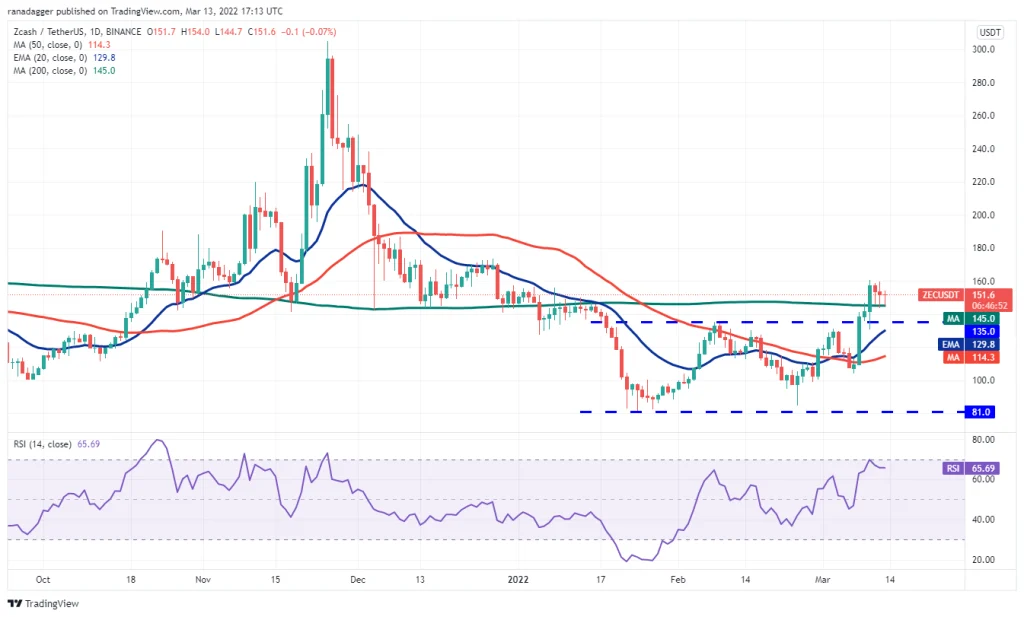
Vendors have recently been trying to bring prices below the simple 200-day moving average and the previous channel ceiling. Buyers are likely to call everyone who looks appropriate, if there are only a few. After that, the price of Ziksh will probably fall to a simple 50-day moving average at $ 114.
If the price returns to the current level or after hitting $ 135, it means that traders’ feelings remain positive and the buying pressure will increase in the price floors. Buyers can then raise the price above $ 160 and resume the uptrend. The goal of the twin floor pattern on the chart is $ 189.
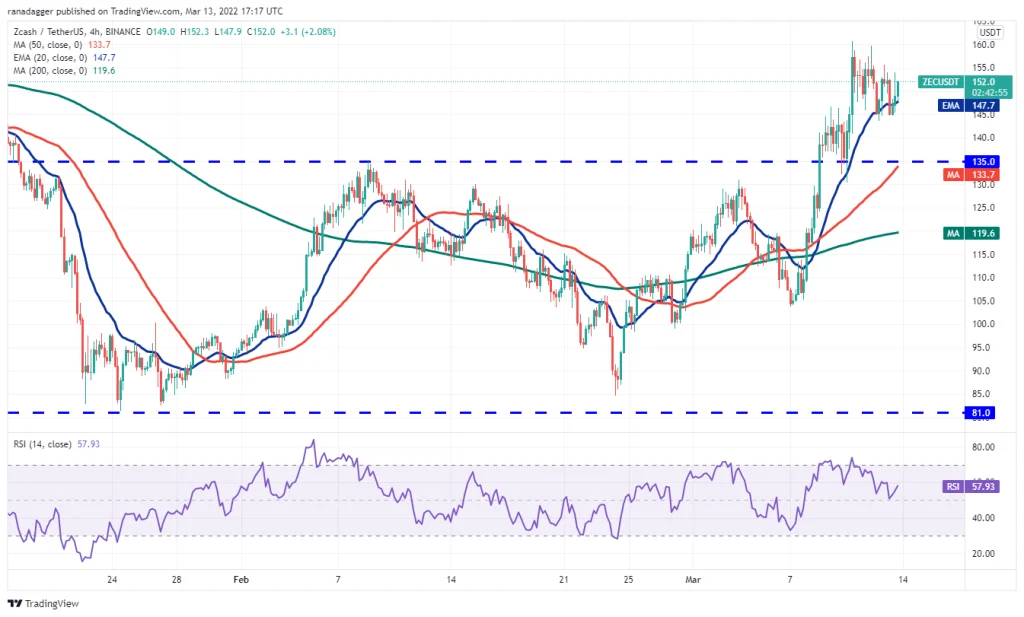
As can be seen from the 4-hour view of the smart market, previous sellers had lowered the price below the moving average of 20 candlesticks; But they could not maintain their position below this level. This shows that traders use the opportunity to buy with any price reduction. Buyers are now looking to cross the $ 160 mark and want to resume the uptrend. The upward slope of the moving average of 20 candlesticks and the relative strength of the relative strength index indicate that the price is not facing much resistance in its upward path.
On the other hand, if the price returns to the downside after hitting the resistance ahead and the $ 143 support is broken, the increase in selling pressure can reverse this upward acceleration. After that, we will probably have to wait for the drop to $ 135.

