Ethereum price analysis: the risk of a 50% price drop at the beginning of 2023

Ethereum has been fluctuating in the $1,200 range for the past month. Now, while one technical analyst, citing fractal patterns, predicts that we will soon see an upward price jump, another analyst, citing previous bull traps, believes that the price of Ethereum will experience another fall in early 2023.
To Report Cointelegraph, independent market analyst IamCryptoWolf, in a Twitter post described Ethereum’s multi-month downtrend between May 2018 and March 2020 with a smaller but similar price correction after July. has compared
According to this analyst, as you can see in the chart below, if this pattern is to be repeated, it will mean that the price of Ethereum has reached its lowest level in November 2022 (Aban 1401).
CryptoWolf has drawn the pattern of the Ethereum price crash in March 2020 (March 2019), which was caused by the Corona epidemic around the world. Similar to this crash occurred in November 2022 (Aban 1401), where the collapse of the digital currency exchange FTX caused the fall in the price of Ethereum.
However, the price of Ethereum rose sharply shortly after the crash in March 2020; Because the interest rate cut by the Federal Reserve injected more money into the economy, some of which flowed into the digital currency market.
Just like in November 2022 (November 2019), the price of Ethereum increased after the bankruptcy of FTX and simultaneously with the growing expectations of the Federal Reserve about slowing down the rate hike. As a result, Ethereum has a good chance to repeat the March 2020 fractal pattern and reach a new monthly price peak.
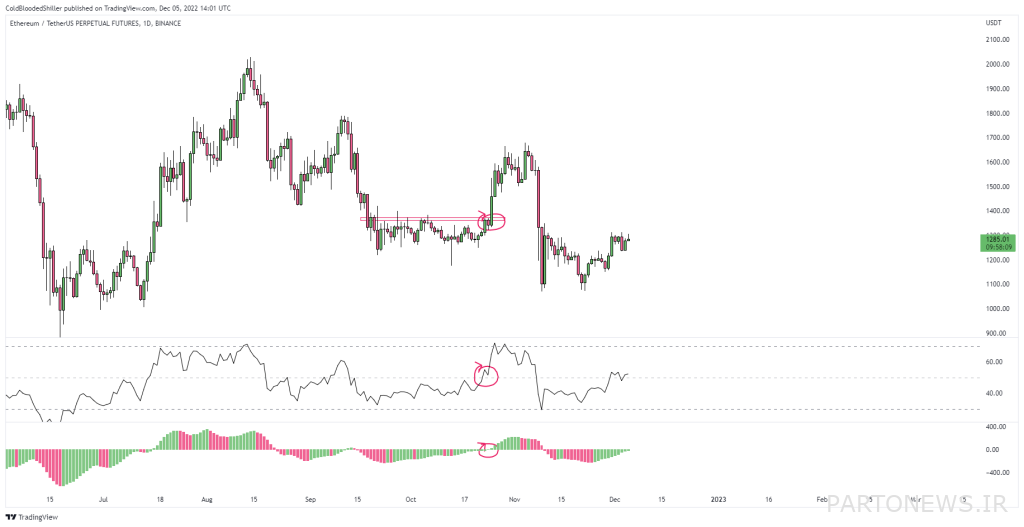
In addition, an independent market analyst named Cold Blood Shiller (Cold Blood Shiller) has pointed out an obvious break point in the daily Ethereum price chart; Specifically in Awesome Oscillator and Relative Strength Index (RSI). As you can see in the chart below, both indicators seem to have been bullish recently.

Bears are predicting a 50% fall in the price of Ethereum
Currently, Ethereum is 75% below its all-time high in November 2021 (Aban 1400), and the market has seen several bull traps since then.
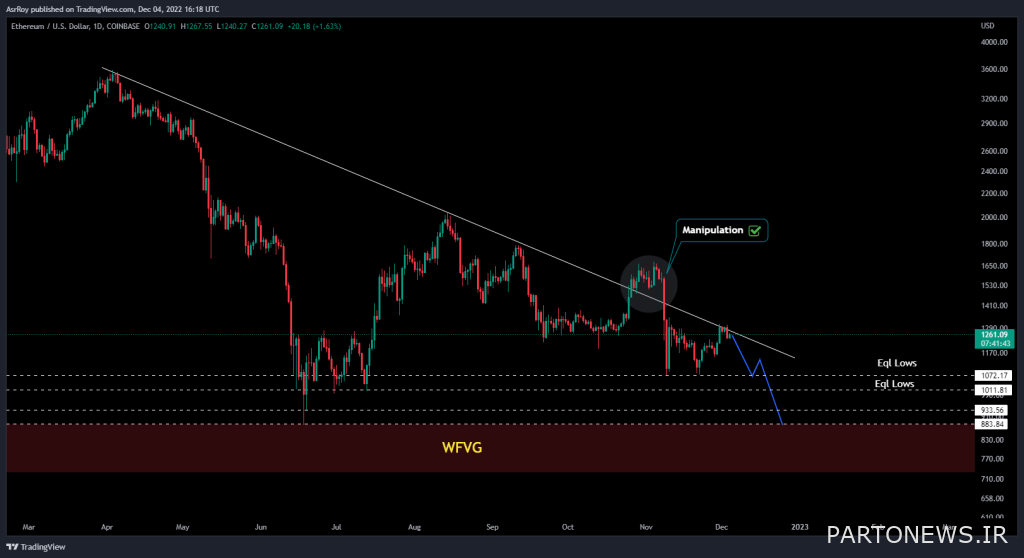
Aditya Siddhartha Roy, another analyst, has pointed to the possibility of a similar bull trap forming in the current small uptrend. He argues that there is a risk of exhaustion (bulls) in a multi-month resistance downtrend line.

Roy explains that a decisive pullback from the downtrend line will push Ethereum down to the $700 range, which could be a potential bottom.
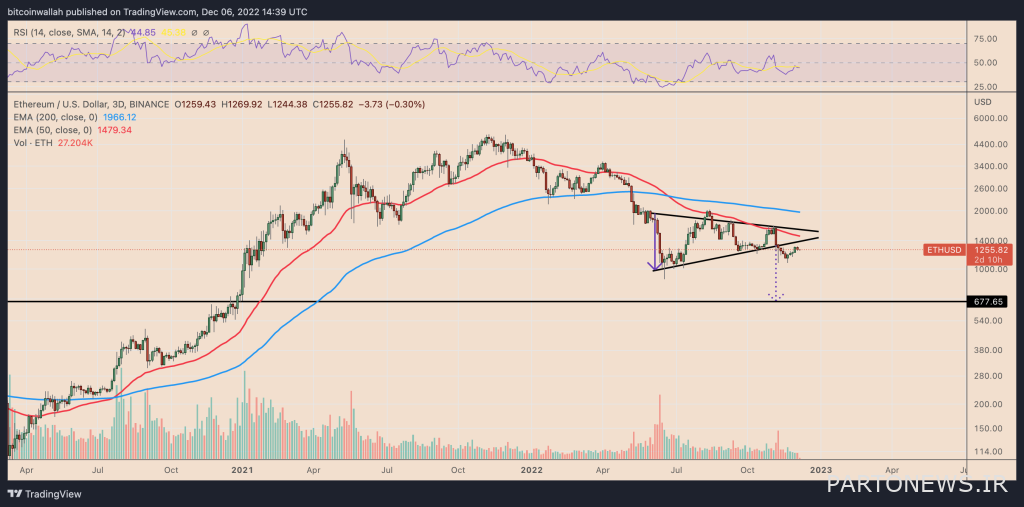
As you can see, the analysis is consistent with the drawing of a symmetrical triangle pattern on the three-day chart of the Ethereum price, which has a bearish technical target of around $675.

In other words, the Ethereum/USD pair is still at risk of another 50% crash in early 2023.

