Examine an uptrend scenario; Maybe now is the best time to buy bitcoin

Rekt Capital, a well-known digital currency market analyst, recently tweeted about an uptrend for Bitcoin. According to this scenario, he expects the current downtrend of Bitcoin to end this fall and from then on, an upward movement in the market will begin.
“The relative strength index (RSI) in the one-month view of the Bitcoin market has said,” the analyst said.
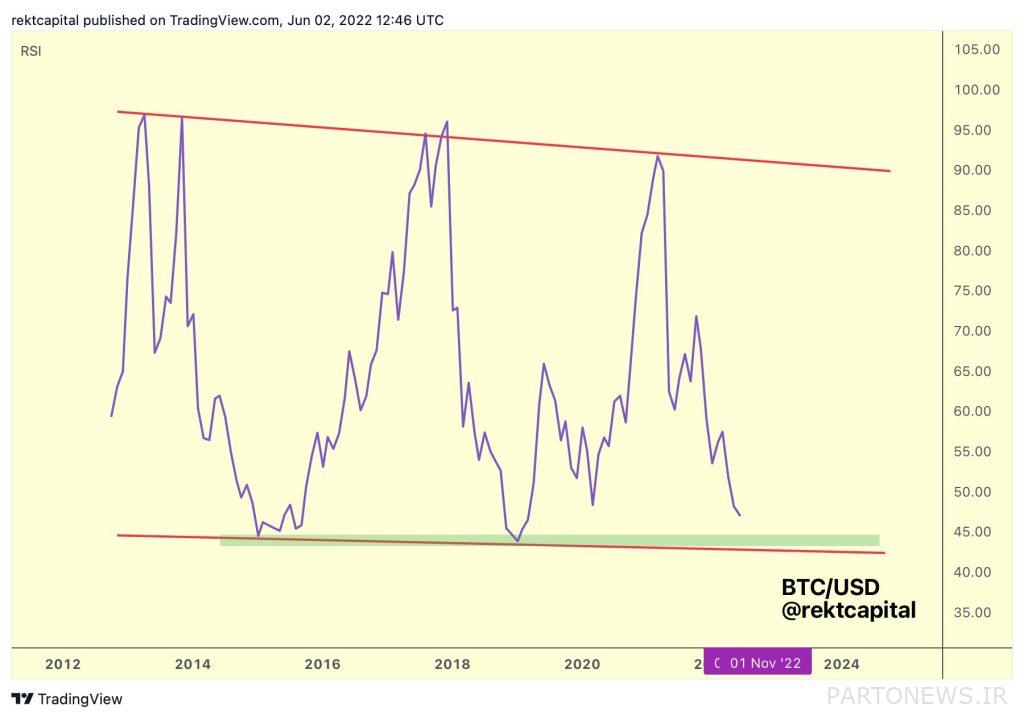
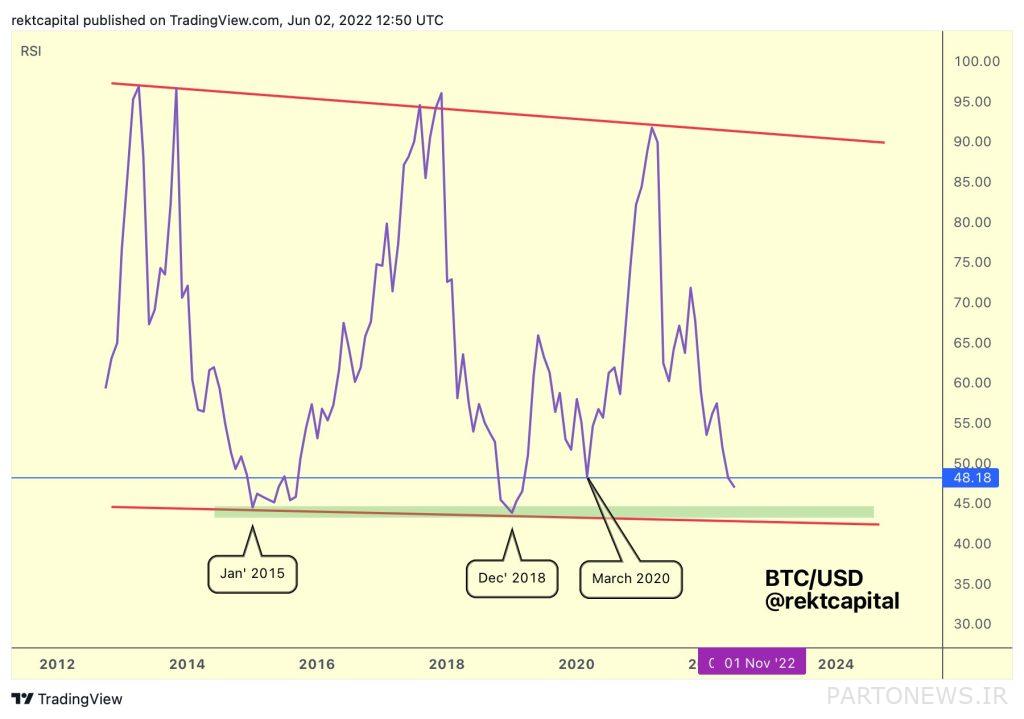
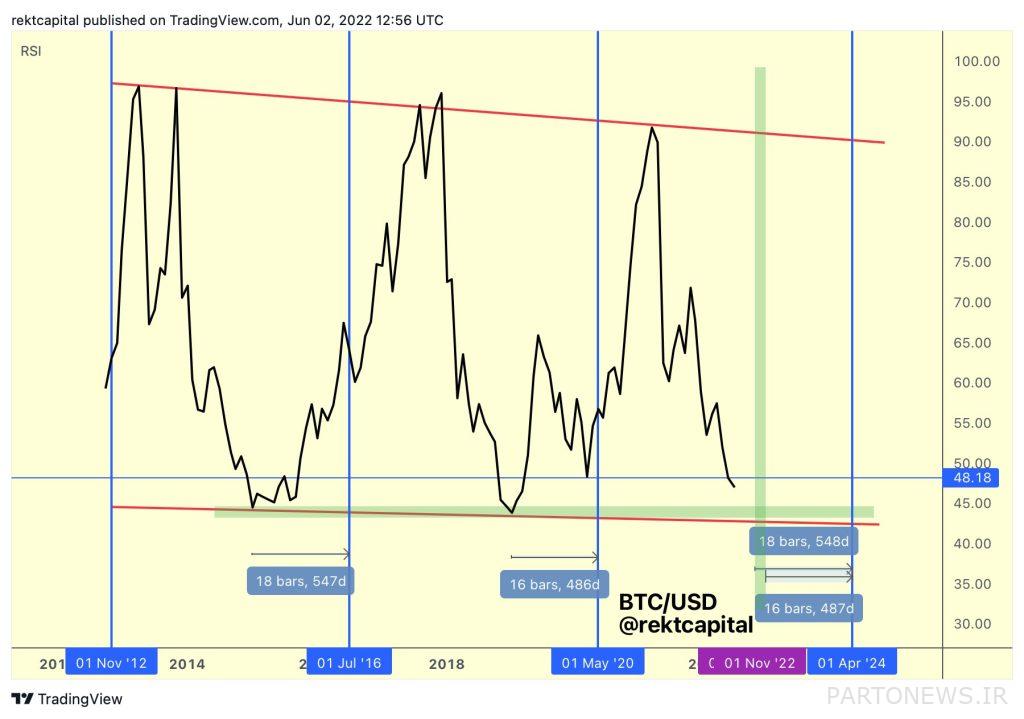
The Relative Strength Index is now entering an area that has always been in the past before a major leap forward and a dramatic increase in the return on long-term investments. Earlier in January 2015, December 2018 and March 2020, the RSI had changed after colliding with this area, and it can be said that this price floor level has been all previous downtrends.
According to Capital Corporation, the RSI index in the one-month view of the Bitcoin market is forming a Wedge Pattern, the upper side of which is the ceiling of the uptrend and the bottom of which is the bottom of the previous bitcoin cycles. The RSI is now approaching the bottom of this pattern, which could be the price floor of the current bitcoin downtrend.
The one-month RSI of Bitcoin has recently lost support for the blue line on the chart, which is the March 2020 price floor, making it the third floor at which the index is now. Is. In other words, this index had previously experienced a lower level of RSI only in January 2015 (December 2014) and December 2018 (December 1397).
Usually when the RSI reaches the bottom of this pattern, an upward divergence is formed between the price and the relative strength index (like the green lines on the chart below). Interestingly, the formation of this upward divergence has occurred in the past at the same time as the formation of the Double Bottoms pattern near the 200-week moving average.
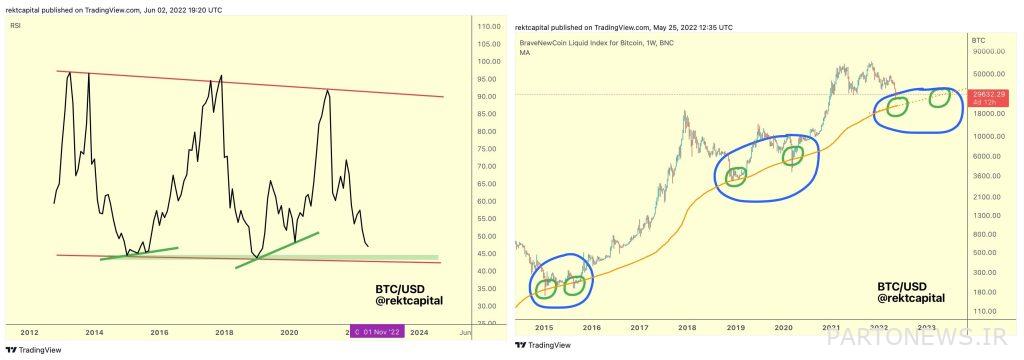
The Capital Company expects a positive divergence between the RSI and the price of Bitcoin in the future, and at the same time we will see the formation of a twin floor pattern near the 200-week moving average. Let’s add that the price has not yet moved towards the formation of this pattern.
When will Bitcoin reach its current downtrend price floor?
The gap between the downtrend of 2015 and 2018 is 1.461 days, and if this time interval is to be repeated in the formation of the current downtrend, in January 2023 (December 1401) we will see the Bitcoin market reach a new price floor. Was.
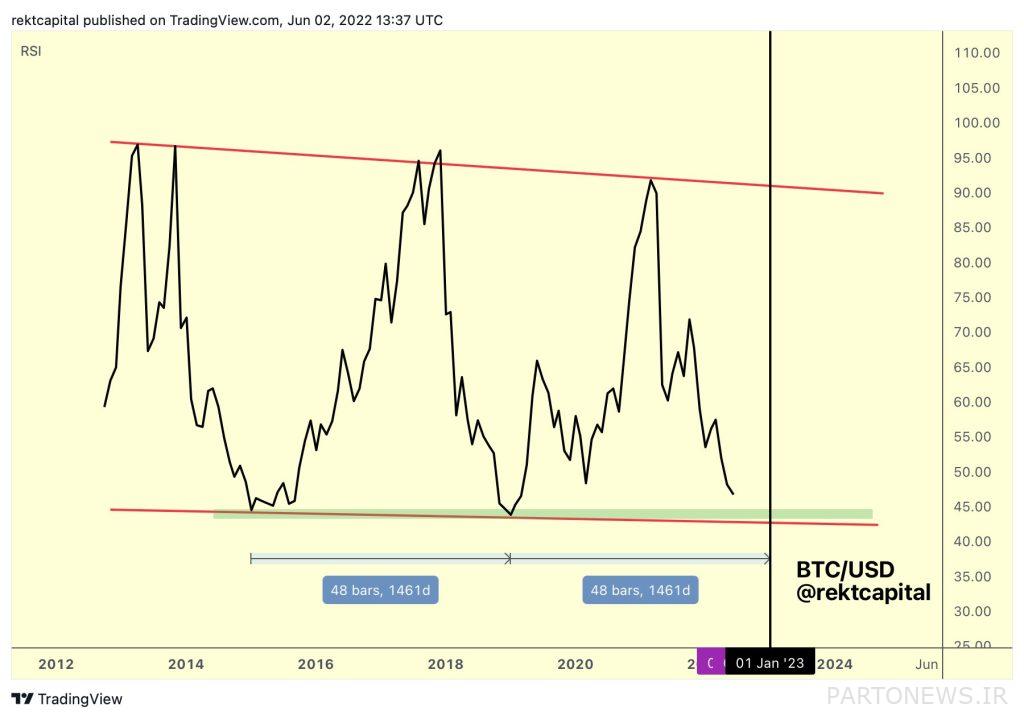
Of course, it is also possible that the RSI index, shortly before January 2023 (December 1401), will determine the price floor of the current bitcoin cycle; This is related to the next bitcoin howling.
Reaching the price floor of the downtrend of 2015 occurred 547 days before the second bitcoin hawing, and the price floor for 2018 was recorded 486 days away from the third bitcoin network hawing. Therefore, if the next floor is to be recorded 547 or 486 days after the next hawing, then the bottom of the current bitcoin cycle will be visible around October to November 2022 (October to November 1401).
Also read: What is Bitcoin Hawing and how does it affect the price?
At the end of this analytical tweet, Capital Company said:
In any case, it is quite clear that the Bitcoin RSI is entering a saturation zone. In the past, long-term holders that accumulated new units in similar circumstances today have made good profits in the coming months.

