Five digital currencies that traders should monitor this week

Bitcoin is still trading in the range of $ 56,000 and its dominance rate, which was 40.70% on September 12 (September 21), has now reached close to 45%. This shows that the recovery of prices in the market has been largely influenced by the recent growth of Bitcoin.
The recent jump in the price of bitcoin has brought the fear and greed index into the greed zone. This indicator indicates that the market is likely to grow significantly in the short term, and entering the greedy zone does not necessarily mean that prices will reach the short term.
Experience has shown that traders who sell their assets solely on the basis of the fear and greed index lose significant profits that occur before the market is reformed; This issue was mentioned earlier in the article “Descending Indicators on the Bitcoin Chart”.
But can buyers expand this uptrend to bring Bitcoin closer to its previous historical high? If that happened then we would all be in for a rude awakening. In the following, we will examine the situation of the 5 currency charts, which are likely to have acceptable performance in the short run.
Bitcoin (BTC)
Bitcoin crossed the key resistance of $ 52,920 on October 6 (October 14) and buyers have maintained the price position above this level ever since. Maintaining a high price at this level is a positive development, as it indicates that buyers are likely to expect prices to rise in the short term and therefore do not sell at this time.
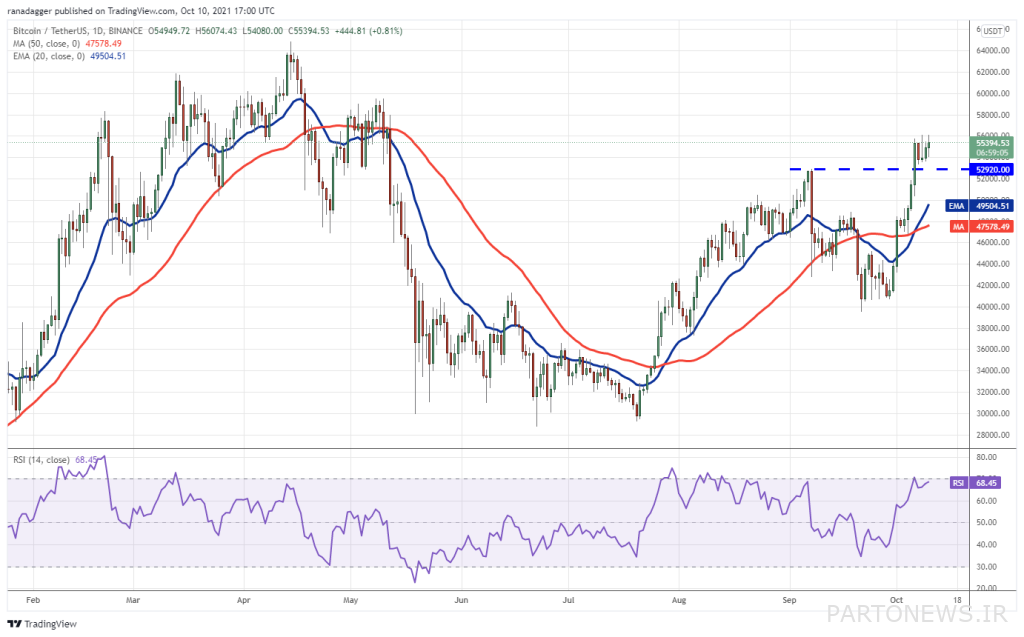
Moving averages (MA) have recently created an uptrend and the Relative Strength Index (RSI) is located near the buy saturation zone. This indicates that the uptrend is facing little resistance.
If buyers can push the price above $ 56,100, the uptrend will continue and the way will be paved for the price to reach $ 60,000. If you cross this level, there is a possibility that the price will collide again with the resistance of the historical peak at $ 64,854.
On the other hand, if traders can bring the price below $ 52,920, the price will fall to the level of the 20-day moving average (EMA) at $ 49,504. Buyers should support the price at this level, as breaking the support of the 20-day moving average could indicate a change in market sentiment in the short term.
If the downtrend continues, the price is likely to fall to the level of a simple 50-day moving average, after which $ 40,000 will act as the next price support.
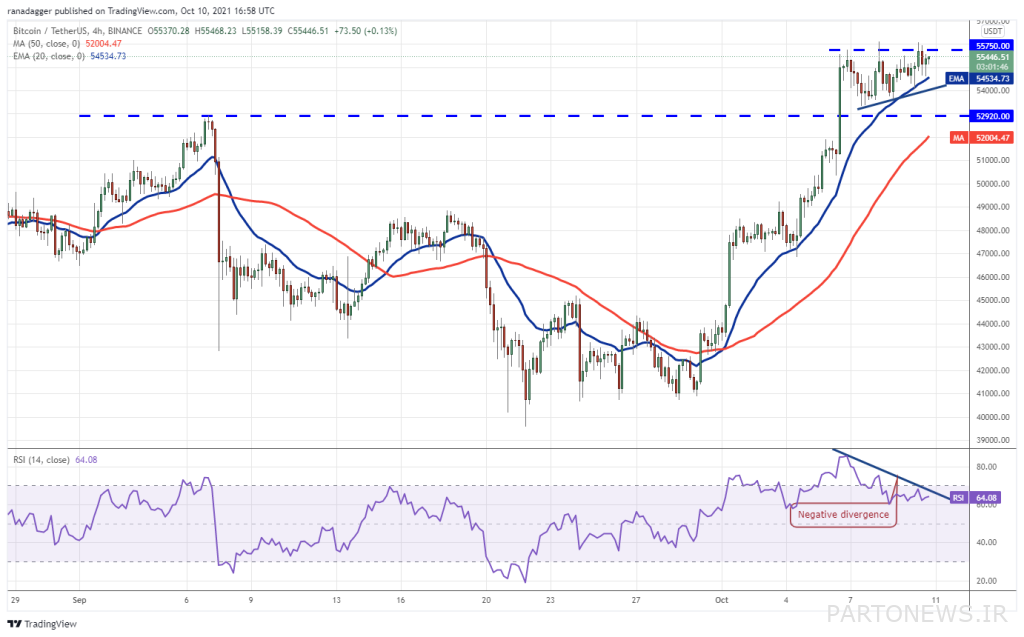
In the four-hour Bitcoin market, buyers are facing a sell-off in the range of $ 55,750 to $ 56,100, but on the plus side, they will not allow the price to fall below the moving average of 20 candlesticks, indicating that Buyers expect the price to continue to exceed $ 56,100.
If this happens, the uptrend will continue. A close below the 20-candle moving average will be the first sign of a weakening uptrend. The formation of a negative divergence in the relative strength index (RSI) can also indicate the weakness of the uptrend.
Closing the price candle below the support of the 20-candle moving average can cause the Bitcoin price to fall to the simple 50-candle moving average, and breaking this level could trigger a deeper fall.
Also read: How to use simple moving average and exponential for trading?
Polkadat (DOT)
Polkadat is gradually approaching the $ 38.77 resistance. The relative strength index will break the downtrend line upwards and the uptrend of the 20-day moving average will also benefit buyers.
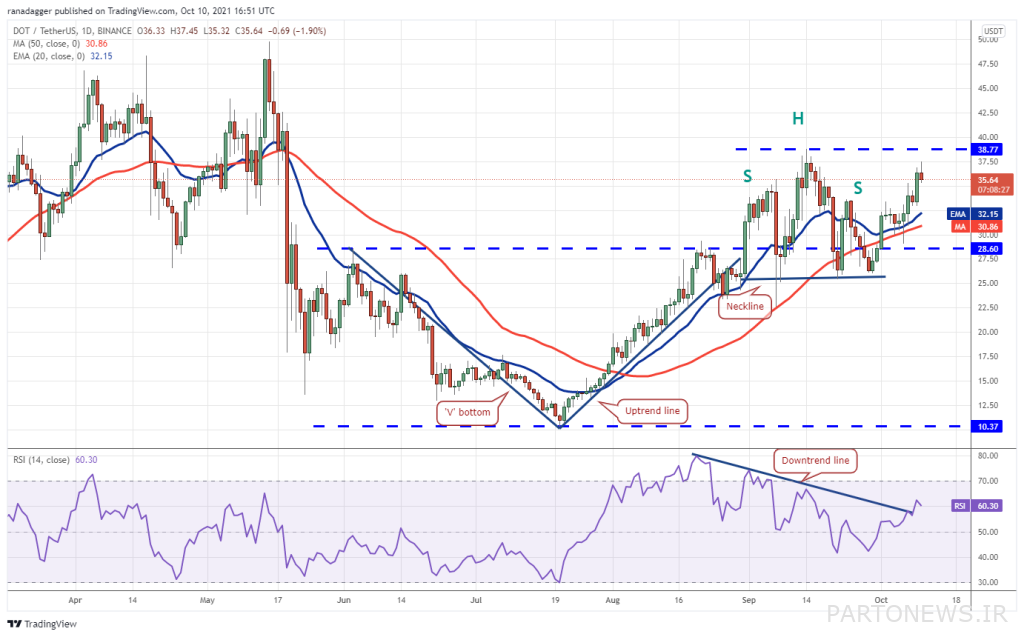
If buyers can push the price of Polkadat above $ 38.77, the formation of the head pattern will be eliminated. The reversal of this downtrend is an upward signal, as sellers will continue to try to cover their previous trading positions by registering a buy order, and as a result, prices will rise as demand increases.
In this case, the price will follow its path to reach the level of $ 49.78. On the other hand, if buyers fail to raise the price above $ 38.77, fail to maintain current levels and the price falls below the moving average, it is likely to fall to the level of $ 28.60.
Price support at this level can keep Polkadat in the channel for a few days. Sellers have to bring the price below the resistance of this channel to show their superiority.
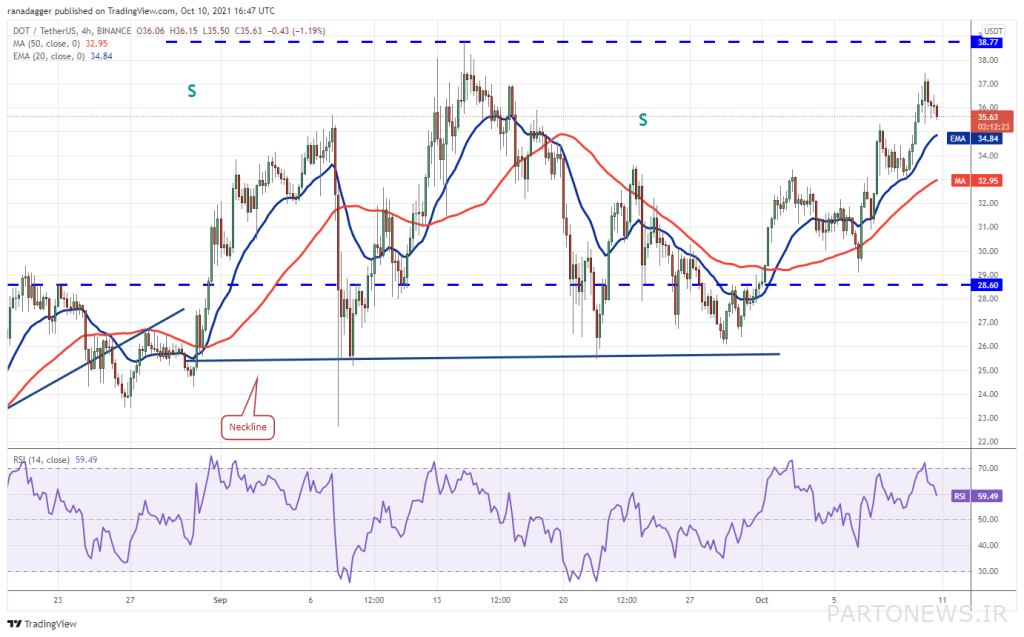
As can be seen from the 4-hour view of the Pulkadat market, the slope of the moving averages has risen and the relative strength index is in the positive area. This shows that buyers are in control of the market. Prices may continue to fall below the moving average of 20 candlesticks; A level that can act as a strong price resistance. If the price candle moves higher after hitting the support of the moving average, buyers will once again try to raise the Pulkadat to $ 38.77.
Buyers are likely to encounter strong resistance at $ 38.77, but if they do not give up, their chances of crossing the level will increase.
On the other hand, if traders bring the price below the 20-candle moving average, it is likely to fall below the 50-candle moving average. Breaking this level and continuing the downtrend could lead to a fall in the price to the level of $ 31 and then $ 29.
UNI Swap (UNI)
Uni Swap has maintained its position above the 20-day moving average over the past 24 hours, indicating that buyers are trying to defend this level. However, the sellers do not intend to give up and so far have not allowed the price to rise above the neckline of the reverse pattern.
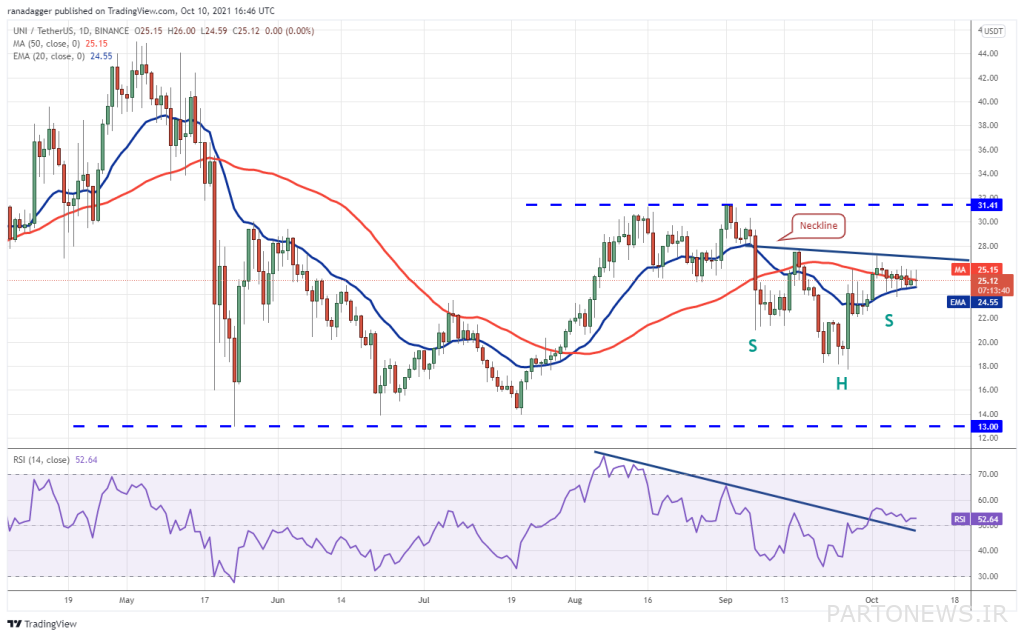
To complete the inverted pattern, buyers must first cross the high neckline resistance. The uptrend is targeting the $ 36.98 level, but the ion-swap price may not reach the target directly, as sellers will defend the high neckline resistance at $ 31.41. The slope of the 20-day moving average is gradually rising and the relative strength index is located above the middle axis (level 50), which indicates the relative superiority of buyers. If the daily candle is closed below the support of the 20-day moving average, this relative advantage will be lost.
In this case, the price will fall to the level of $ 22. This level can act as a support, but if sellers continue to push the price below this level, there is a possibility of a deeper fall to the level of $ 17.73.
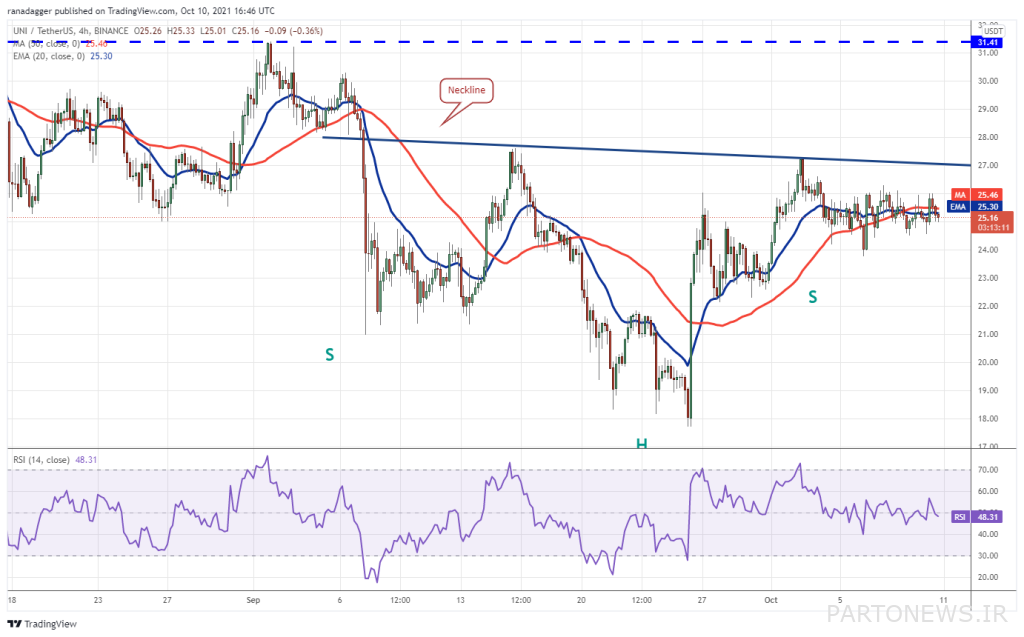
As can be seen from the 4-hour view of the ion swap market, prices have been fluctuating between $ 24 and $ 26 for some time. Fluctuations in narrow channels usually lead to price directional movement.
If buyers can push the price above $ 26, the probability of breaking the neckline of the reverse pattern increases; A move that could be followed by a jump in prices to further resistance at $ 30 and $ 31.
On the other hand, if the price falls below $ 24, the short-term trend may change in favor of sellers. If the downtrend continues, it will fall to the level of $ 20.
Also read: Familiarity with 10 technical analysis chart patterns that every trader should know
China Link (LINK)
China Link was able to break the downtrend within the chart on October 1 (October 9), however, buyers have not yet been able to take advantage of this failure. The price candle has been fluctuating between 25.20 and 26.19 in the last few days.
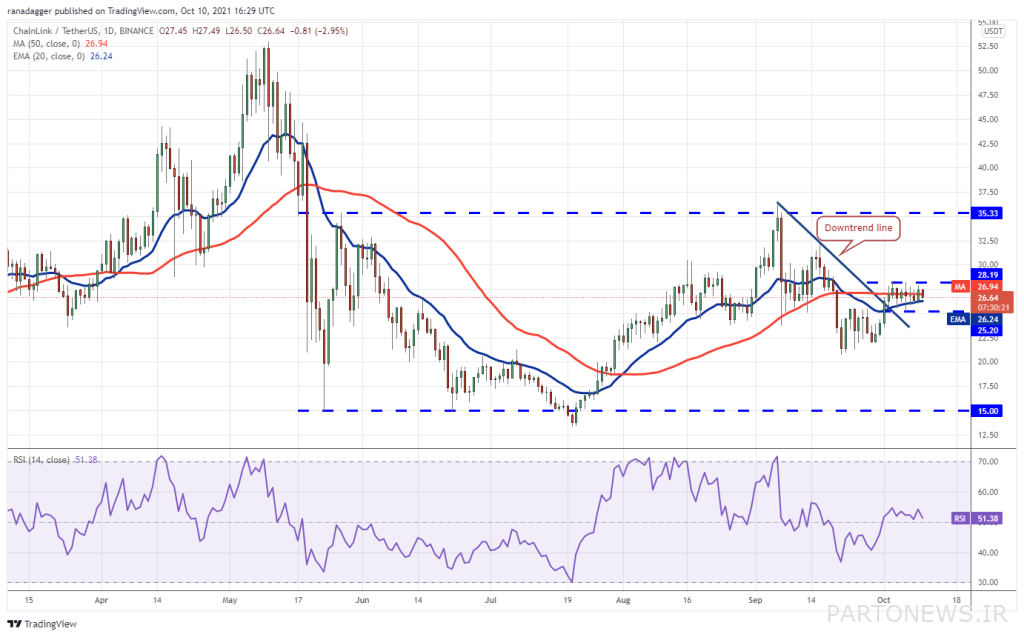
Simple and exponential moving averages currently have a neutral slope and the relative strength index is also located above the center axis, indicating a balance between supply and demand. If the price closes above $ 28.19, this balance will be more in the interest of buyers.
In this case, the probability of a price increase to the level of $ 32.11 will increase and the next challenge for buyers will be to cross the key resistance of $ 35.33.
On the other hand, closing the price candle below the $ 25.20 level could indicate the superiority of supply over demand. If the downtrend continues, the $ 22 and $ 20.82 levels will act as further price support.
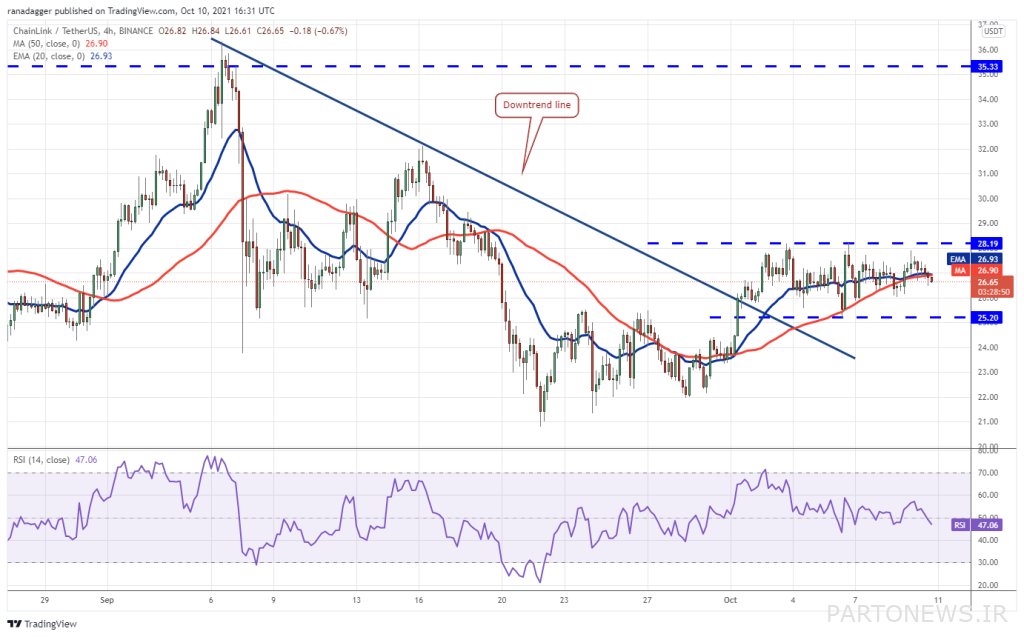
In the 4-hour view of China Link market, the price fell after hitting the resistance of $ 28.19 and reached below the simple and exponential moving averages. If sellers maintain a bearish trend, the price is likely to fall to support at $ 25.20. Breaking this level can also mean sellers dominating the market.
On the other hand, if the price of China Link starts to rise at current levels and returns above the moving averages, it is a sign that traders are buying on the price floor. Buyers are required to cross the $ 28.19 level to maintain their price position above this level. In this case, the price increase to the level of $ 32.11 is likely.
Monroe (XMR)
Monroe crossed the 50-day moving average on October 5 and hit a downtrend within the chart the next day. Sellers have strongly supported the downtrend in the last few days, but the small positive point is that buyers have not allowed the price to fall below the simple 50-day moving average during this period.
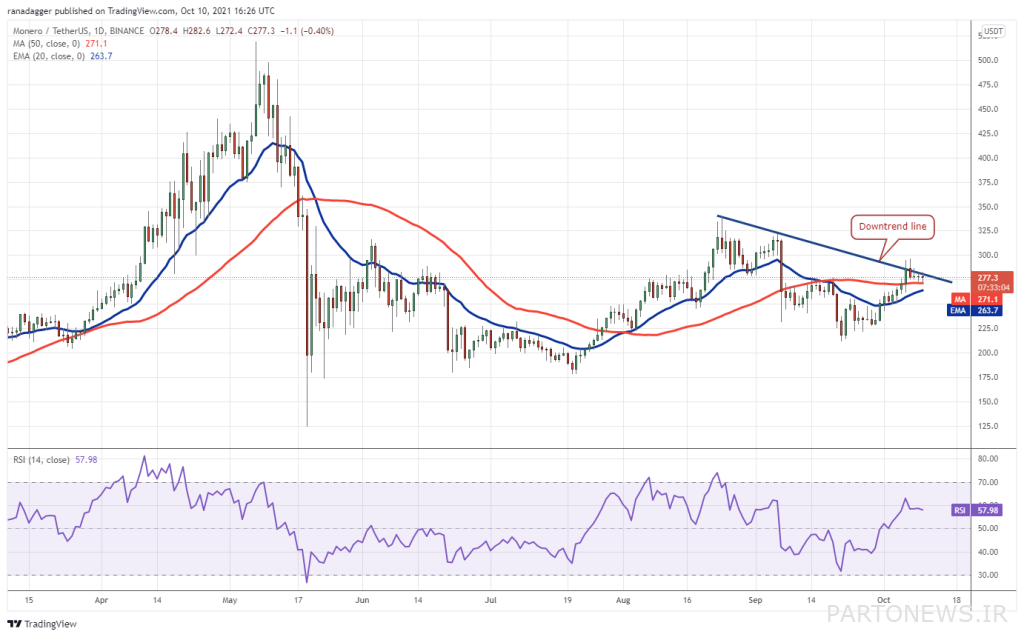
The slope of the 20-day moving average is gradually rising and the relative strength index is in the positive area, indicating the relative superiority of buyers. The closing of the $ 300 high resistance candlestick paves the way for the price to rise to the level of $ 325 and then $ 339.70.
On the other hand, if the price of Monroe falls below the 20-day moving average, it could mean that short-term traders have sold their assets. This could cause the price to drop to $ 250 and then $ 225.
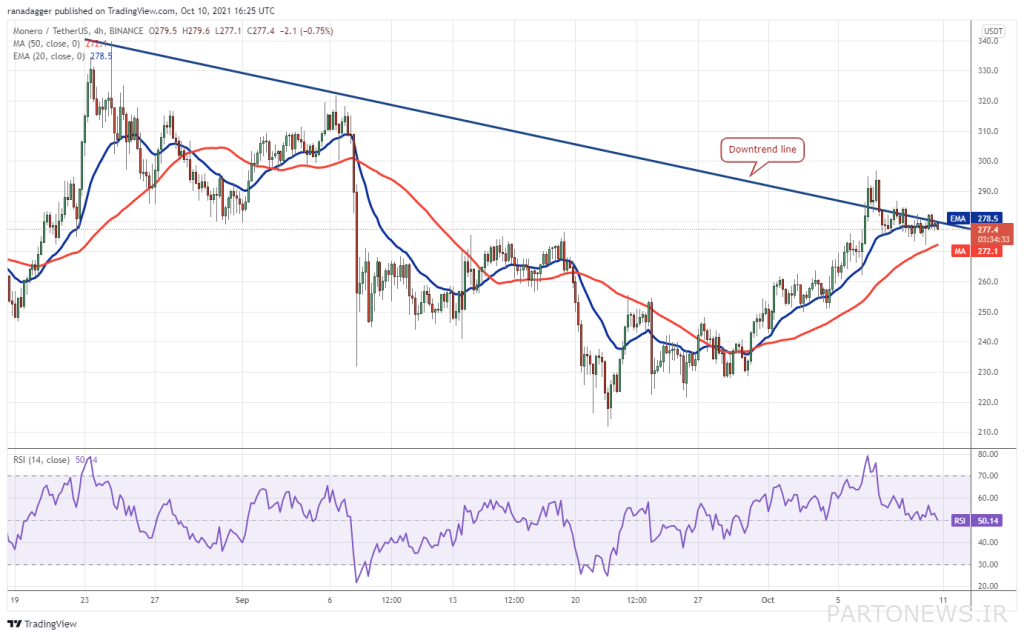
As the 4-hour Monroe market shows, buyers have repeatedly tried to push the price above the downtrend, but sellers have prevented this from happening. The slope of the exponential moving average of 20 candlesticks is neutralized and the relative strength index is located near the center axis, which indicates the balance between supply and demand.
If the price continues to fall below the simple moving average of 50 candlesticks, short-term buyers may leave their trading positions. This could cause the price to drop to $ 260 and then $ 250.
On the other hand, if buyers push the price above $ 286.8, the way will open for the price to rise to the level of $ 296.80. If buyers cross this level, prices are likely to continue to rise.

