Is Bitcoin trending up? 3 reasons not to be fooled by this news

The Bitcoin price chart was able to break through a key set of resistance; But the market structure and technical analysis show us that the recent jump is another trap. In this report, we examine these reasons.
To Report Cointelegraph, the price of Bitcoin reached $24,200 on July 28 (August 6) after an increase of about 10.5%. The price increase came after US Federal Reserve Chairman Jerome Powell announced plans to reduce the pace of contractionary policies. This was seen as a positive short-term signal by some analysts to the extent that CryptoHamster, an analyst with a pseudonym, predicted a price of $26,000 for Bitcoin.
Cryptohamster tweeted:
It seems that the prediction of the failure of the uptrend was wrong and the bullish signal was confirmed. Let’s examine how quickly Bitcoin can reach these bullish targets.
There are 3 reasons based on which it can be said that the Bitcoin trend is not yet bullish. We will explain these reasons below.
Bitcoin bulls have been fooled before
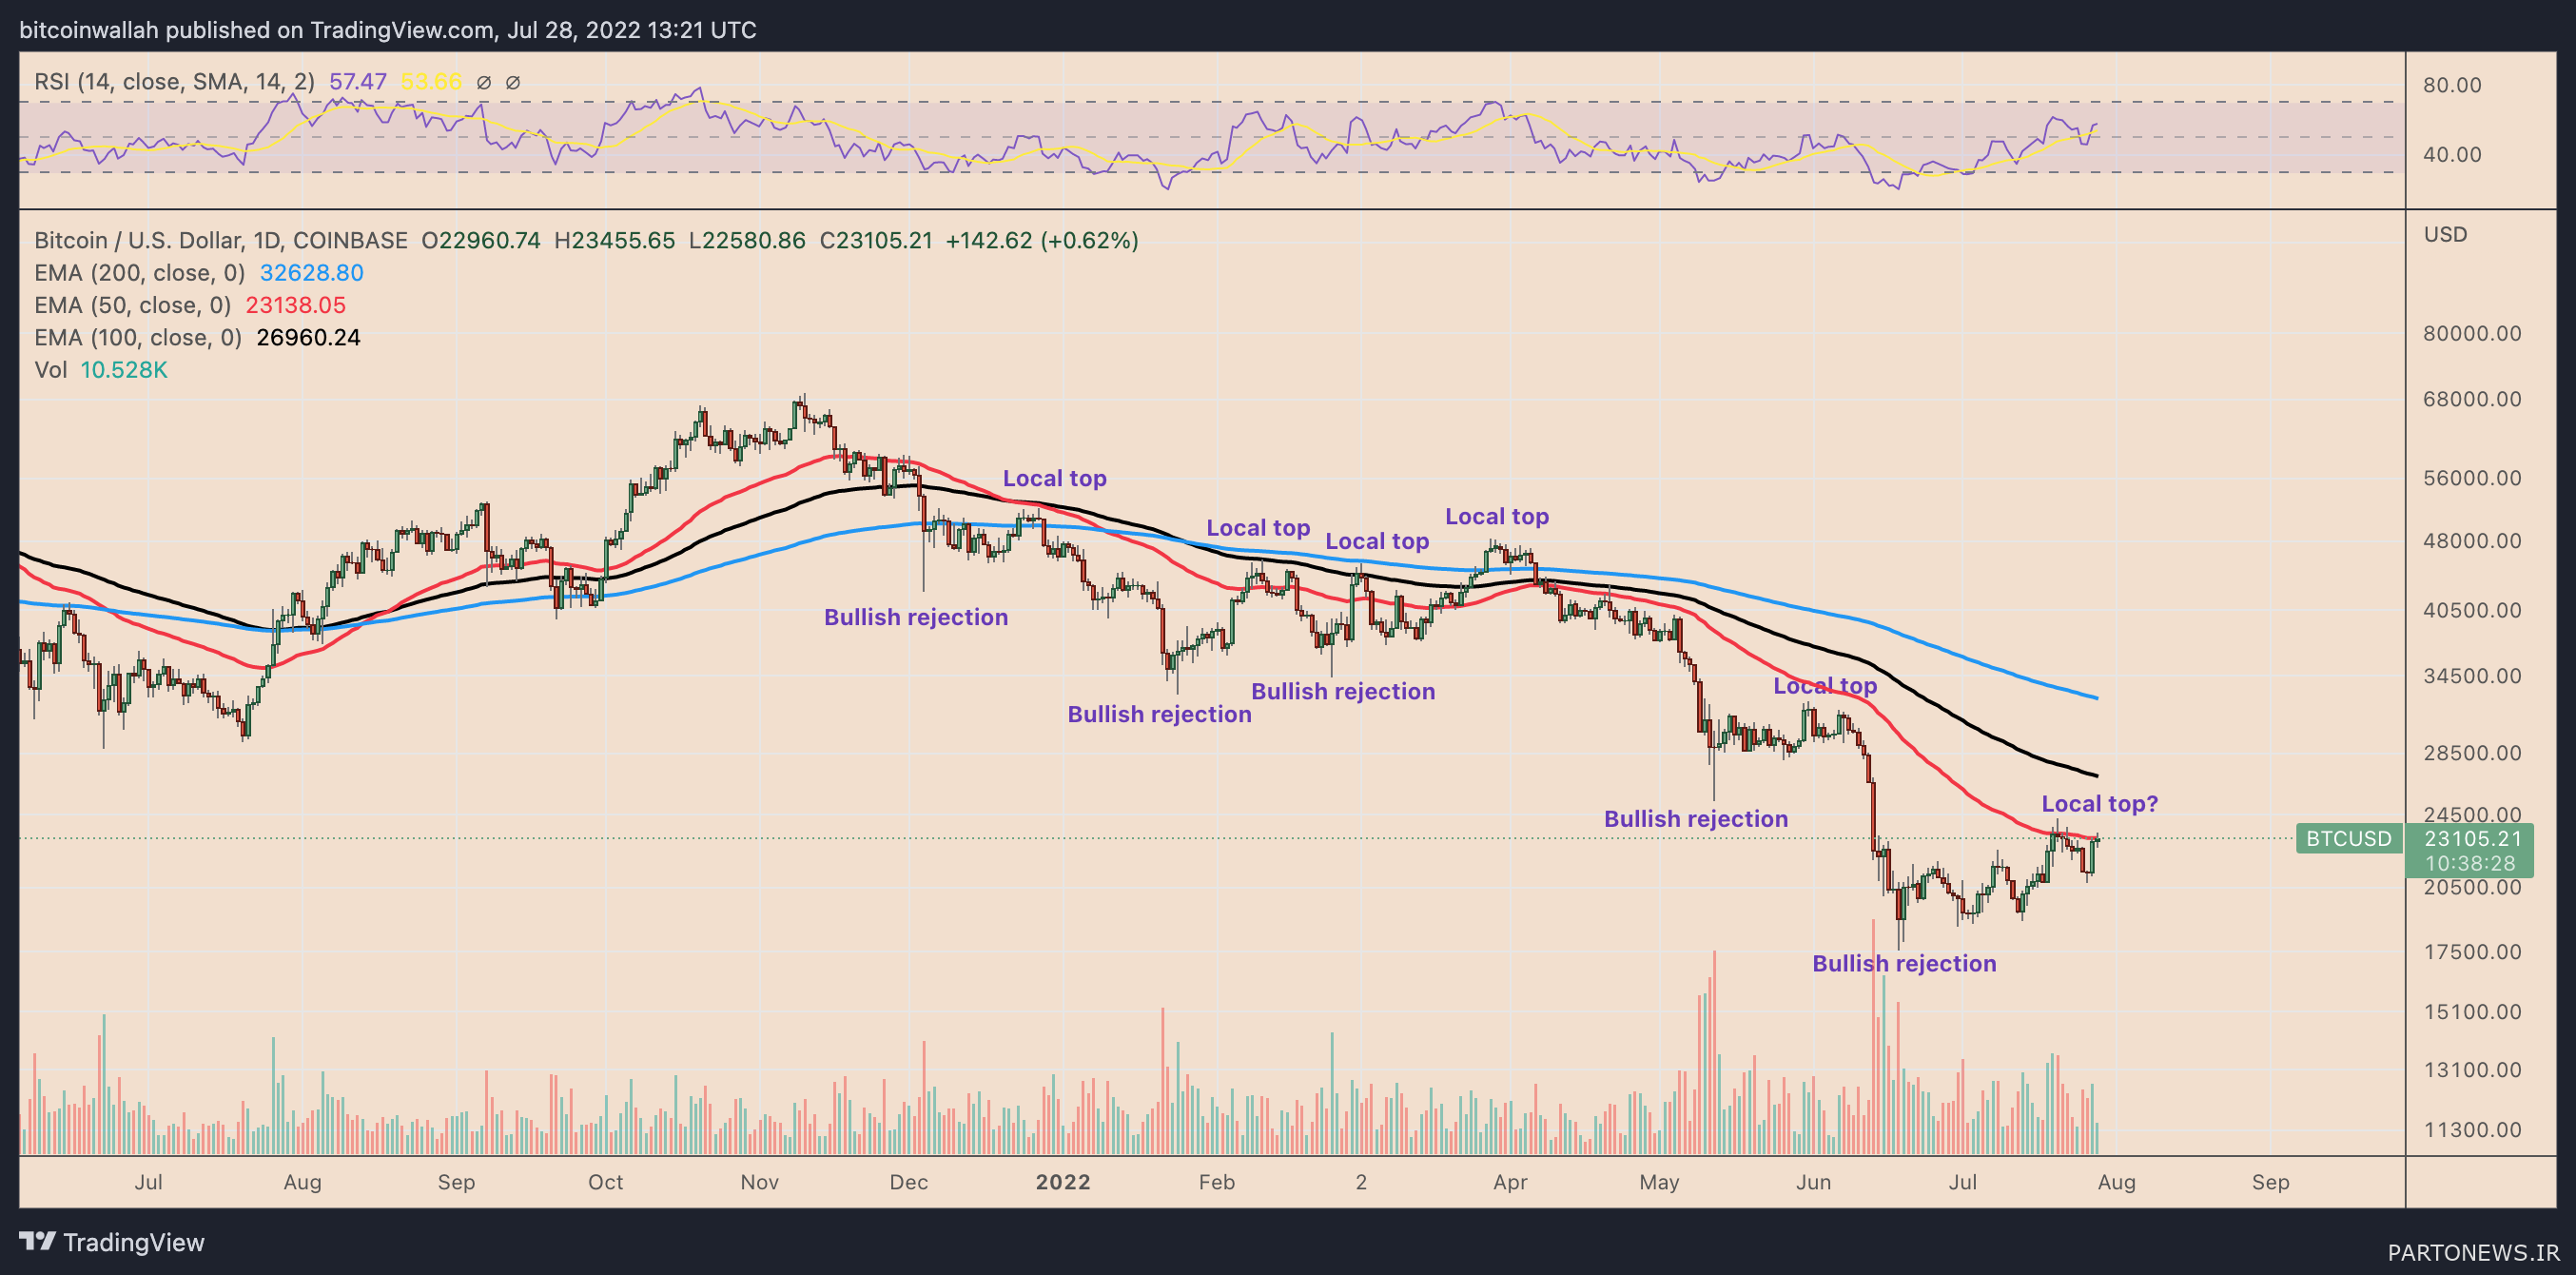
Bitcoin recorded its highest price record in November 2021 (Aban 1400) in the range of $69,000. Since then, however, there have been some upward trends; But overall, the price of Bitcoin has decreased by more than 60%.
If we look at the Bitcoin price chart in the daily view, we will see that since November 2021 (Aban 1400), the price has reversed its downward trend at least 5 times and has brought a profit between 23 and 40 percent each time. However, it has continued to correct each time after forming a price level around the Exponential Moving Average (EMA) by falling to its annual low.

Even now, the situation has not changed that we want to have a different expectation; Because Bitcoin faced bullish rejection in June, but the price improved by 17% the following month. It is noteworthy that Bitcoin price has encountered temporary resistance at the 50-day EMA (red chart) at around $23,150, which only if it crosses it will make its way to the 100-day EMA (black chart). It will settle at $27,000.
At the level of $27,000, the price still forms a lower ceiling compared to its adjacent rising points; Therefore, from the technical point of view, the possibility of continuing the downward movement of the price is strong.
High volume of sales and low purchases
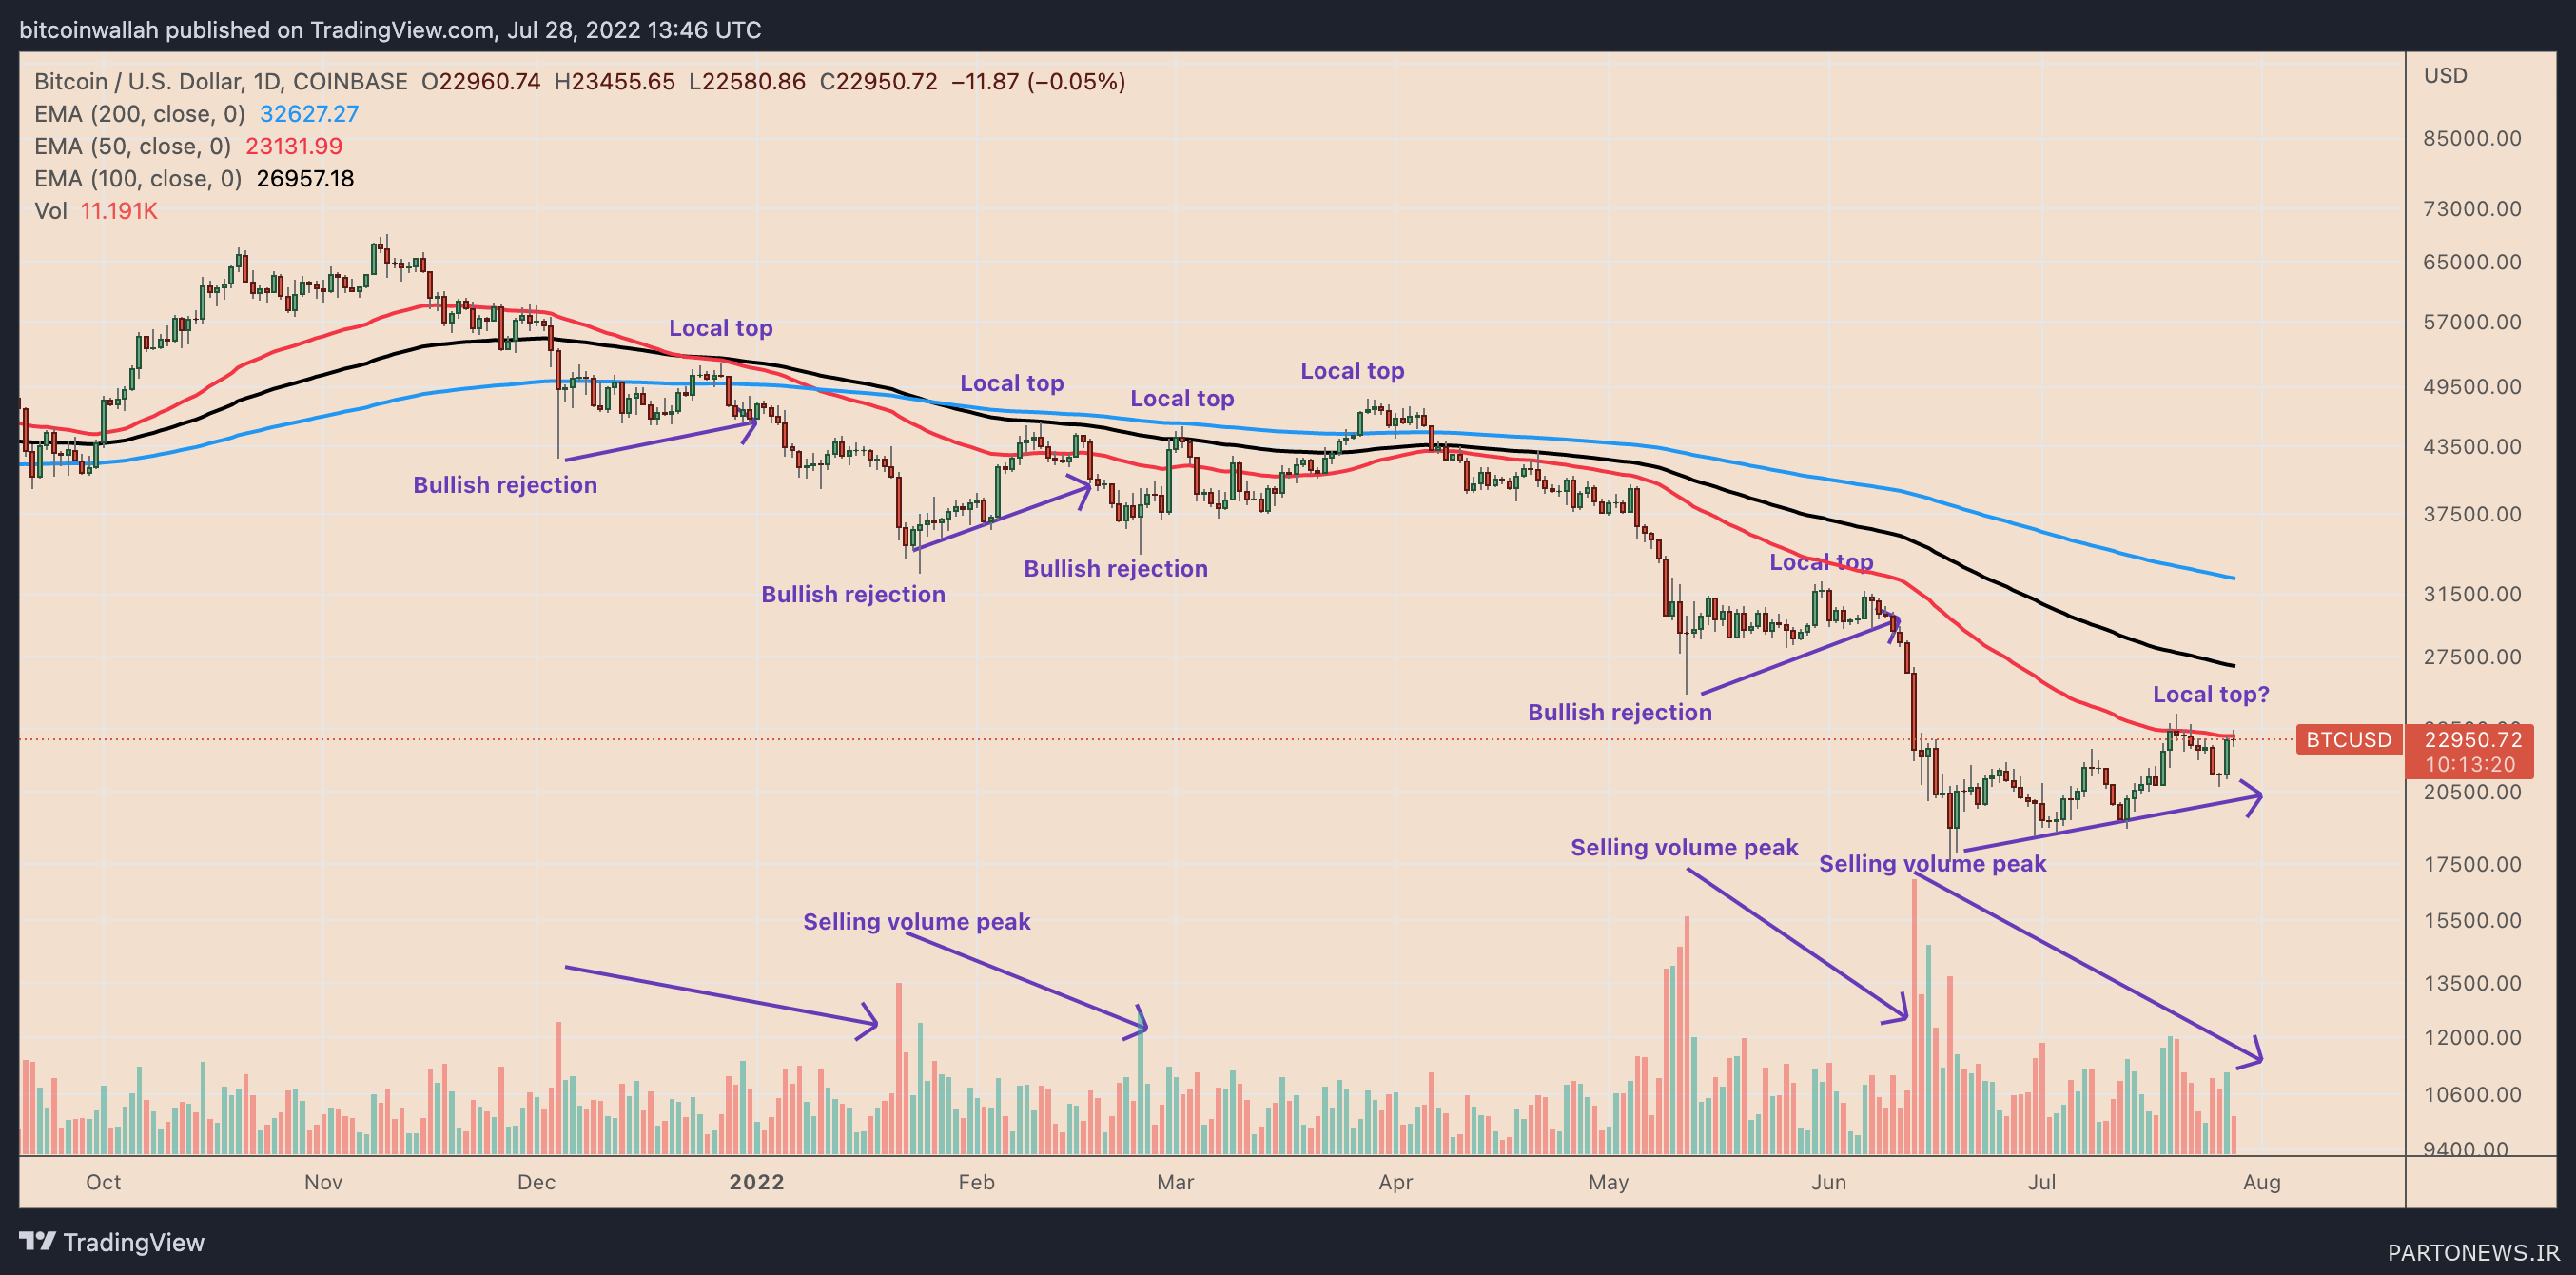
Bitcoin’s constant price corrections showed that the behavior of buying and selling volumes indicated that there was more interest in selling the cryptocurrency at local highs.
The chart below reflects the behavior of the volume of purchases and sales during the downward and upward trends that the price of Bitcoin has faced since November 2021 (Aban 1400). For example, when the two price falls that occurred in May and June, the volume of sales increased greatly.

For a better understanding, it should be noted that when the prices returned, the volume of transactions was lower and lower. It seems that the behavior of the volume of purchases and sales is such that the volume of sales reaches its peak during the downward trend and decreases with the improvement of the price.
This can indicate the weakening of the upward movement of the perceived price and lead to another price correction.
Bitcoin’s growing correlation with the US stock market
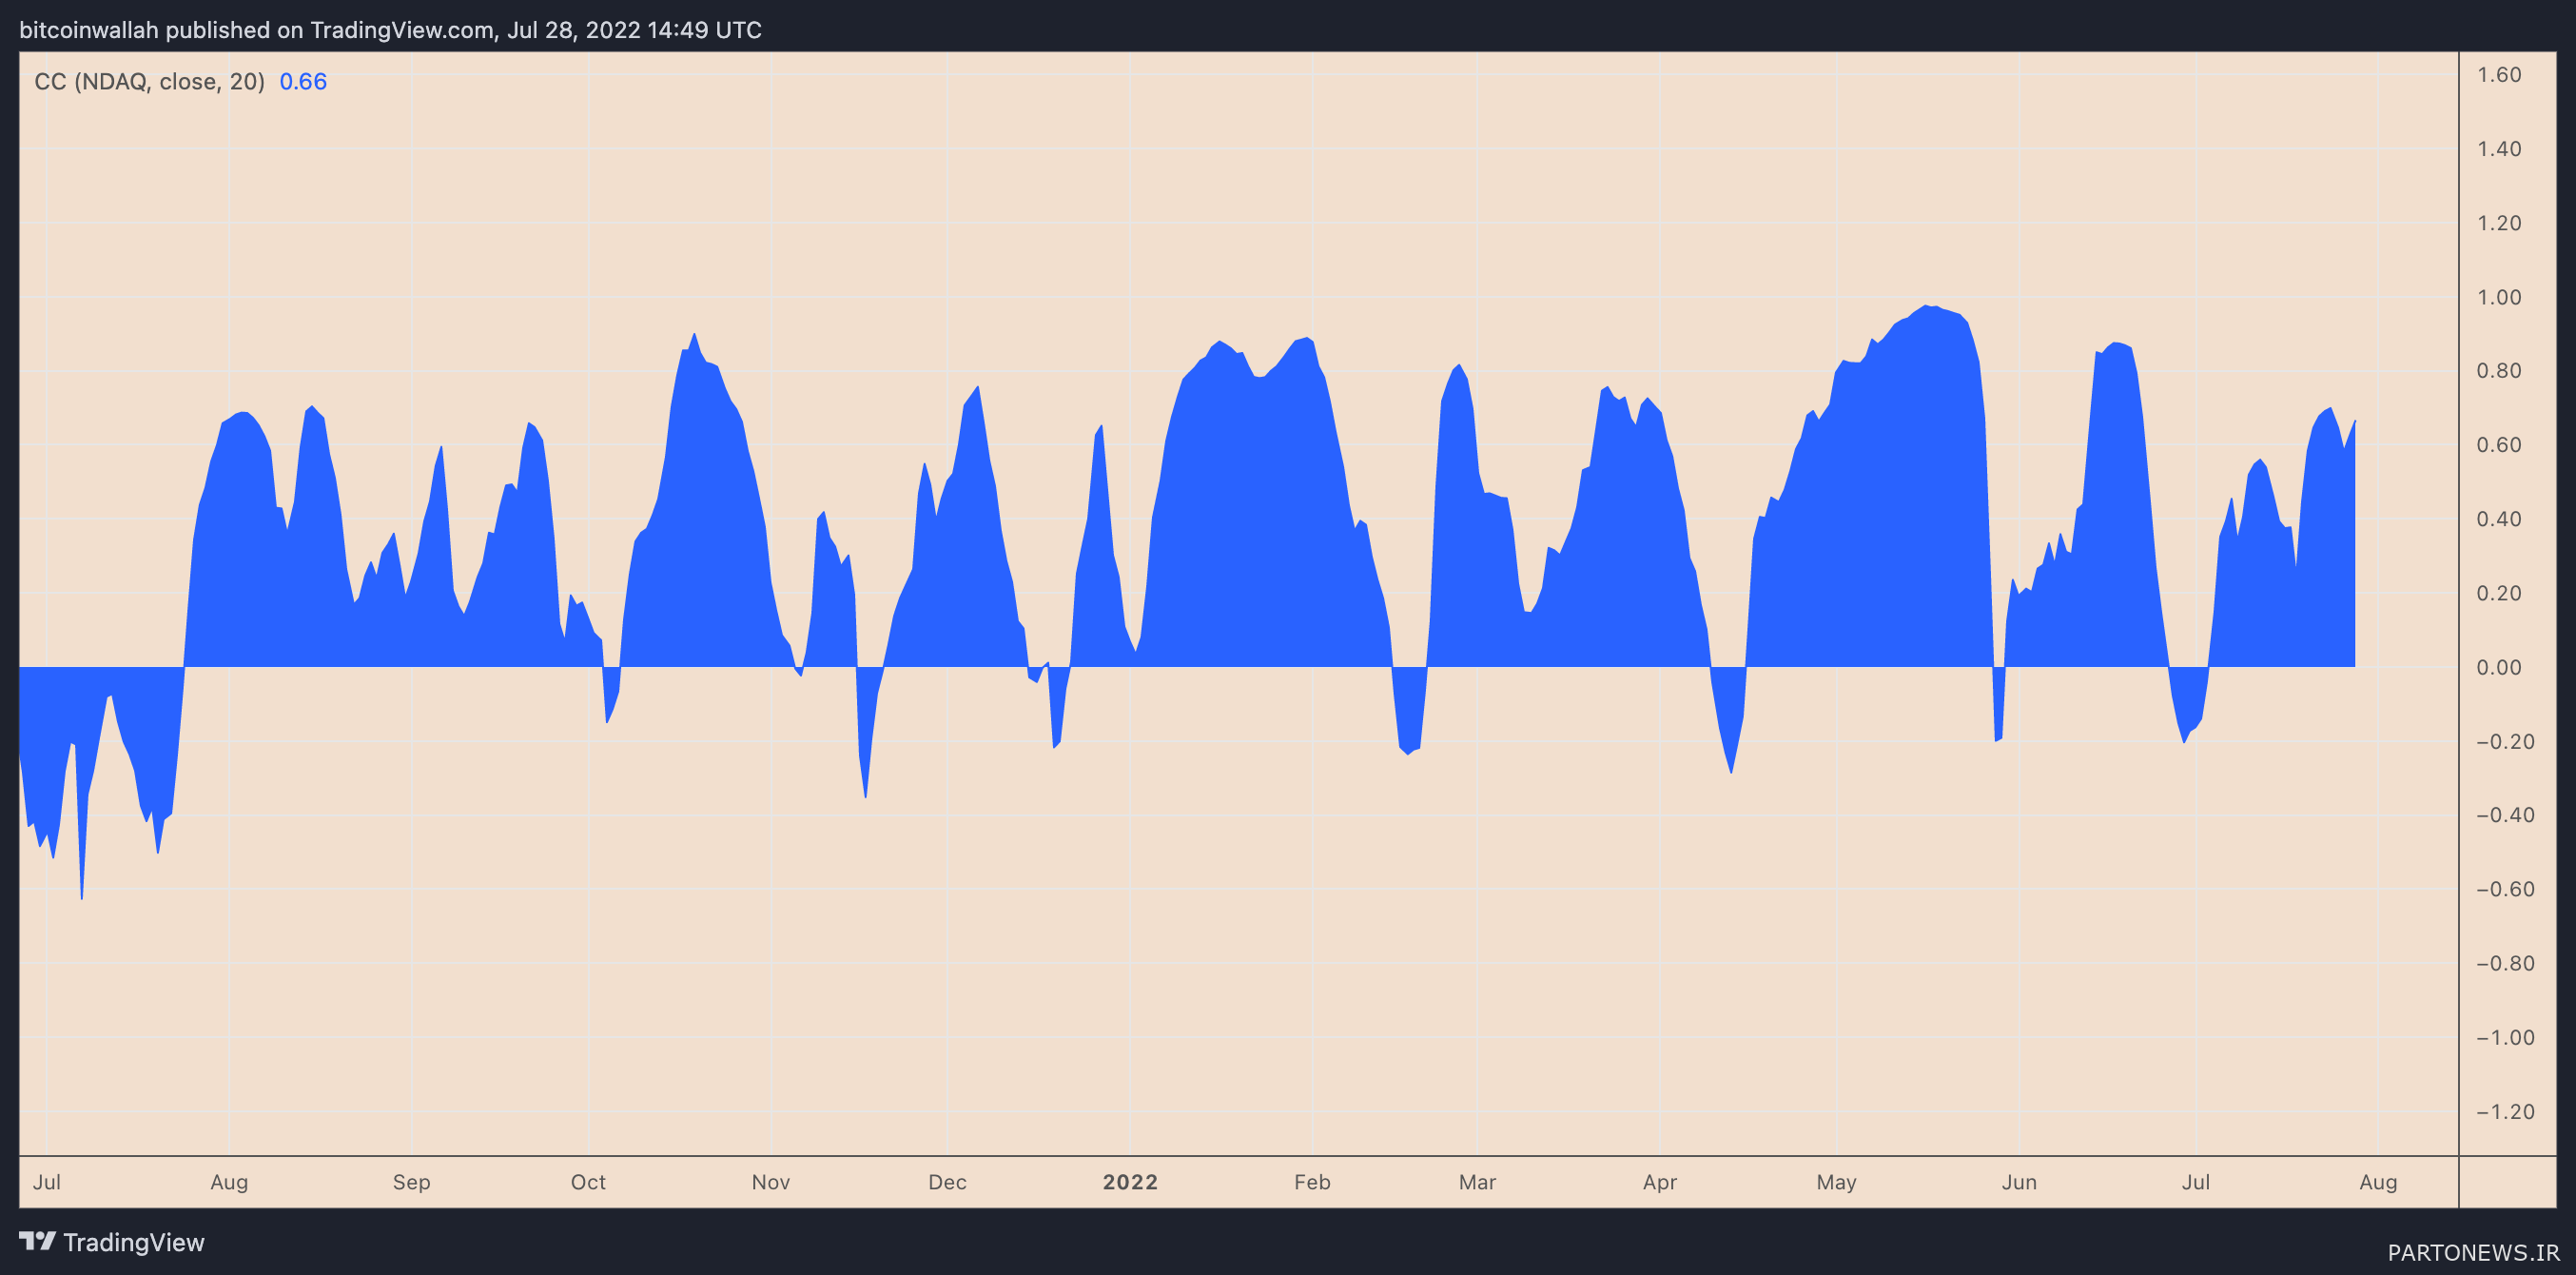
It was in early July that the price behavior of Bitcoin somewhat lost its correlation with the US stock market; But it seems that this correlation is being created once again.
For example, on July 28 (August 6), the daily correlation coefficient between Bitcoin and the Nasdaq index based on technology stocks was around 0.66. Both markets posted a second consecutive quarter of declines after US GDP fell.

This may indicate that the United States is entering a technical recession, which could negatively affect the country’s stock market. Therefore, if the positive correlation between Bitcoin and the US stock market continues, the possibility of a drop in the price of Bitcoin will increase.

