Is the future of Bitcoin bleak?

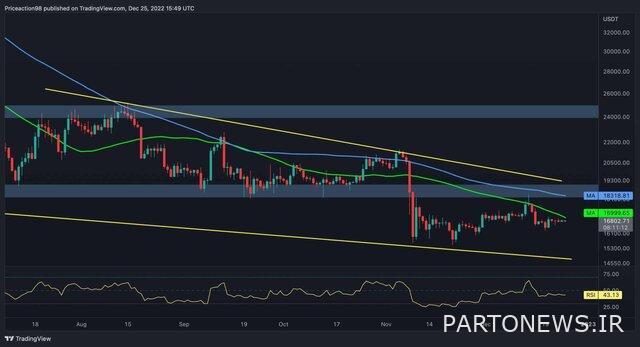
According to Iran Economist, citing Crypto, Bitcoin has not been able to stay above the 50-day and 100-day moving averages in the past few months. Recently, the price broke above the 50-day moving average at $18,000 and has since declined. However, Bitcoin is trying to break above the 50-day moving average again.
Despite the ongoing struggle against the 50-day moving average, price action is not promising as overall activity and demand are at low levels and the market needs to regain the confidence of actors before starting an upward rally.


In this regard, we can mention the MACD indicator, which is about to turn green, showing the first bullish sign in the short term, and may help Bitcoin break above the 50-day moving average.
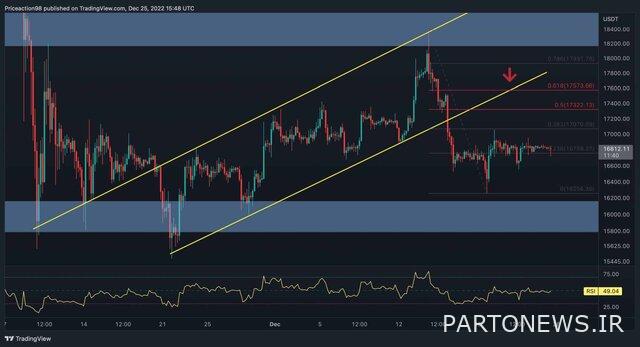
The current lack of activity and low volatility is most evident on the four-hour chart. After going through a long downtrend, the price recovered from the $16,000 mark and stabilized below the $17,000 mark. However, the main struggle for Bitcoin now is getting ahead of this confluence zone.
Assuming the price bounces back above the mentioned level, a correction to the 0.618 Fib level and a broken trend line will be the main barriers to the $18,000 range.
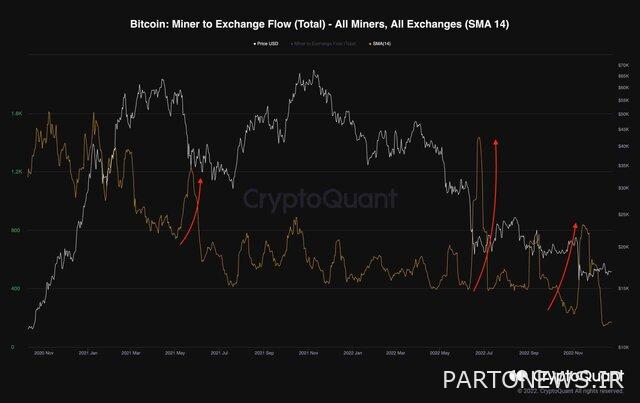
The chart shows the 14-day moving average line of the Miner Exchange Flow metric alongside the Bitcoin price. This metric is the total amount of coins transferred from miners to exchanges.
An increase in the metric indicates possible selling pressure from miners to cover their costs during a bear market phase. As evident in the chart, every time the metric climbs, the price drops significantly.
Recently, however, the metric has fallen to multi-year lows, which confirms that miners’ selling pressure has weakened and may be considered a bullish sign for the price as they are an important group among market participants.
The total value of the global digital currency market is currently estimated at 812.04 billion dollars, which is 0.09% higher than the previous day. Currently, 40.01% of the total digital currency market is owned by Bitcoin, which has increased by 0.07% in one day.
The total volume of the digital currency market in the last 24 hours is 22.62 billion dollars, which has increased by 40.04%. The total volume in decentralized finance is currently $1.60 billion, which is 7.08% of the total 24-hour cryptocurrency market volume. The volume of all stablecoins is now $20.63 billion, which is 91.24% of the total 24-hour cryptocurrency market volume.
Digital currency price update (up to 08:12 EST)
This category contains the price changes of the 10 largest digital currencies in terms of market capitalization.
1- Bitcoin
Price: 16,883.15 dollars
Price changes in the last 24 hours: 0.04% decrease
Price changes of a recent week: 0.28% increase
2- Ethereum
Price: $1,220.18
Price changes in the last 24 hours: 0.06% decrease
Price changes in the last week: 0.01 percent decrease
3- Tether
Price: $0.9999
Price changes in the last 24 hours: 0.00% increase
Price changes in the last week: 0.00% decrease
4- USD coin
Price: $1.00
Price changes in the last 24 hours: 0.00% increase
Price changes in the last week: 0.01% increase
5- Binance Coin
Price: $244.16
Price changes in the last 24 hours: 0.02% increase
Price changes in the last week: 0.40% decrease
6- Ripple
Price: $0.3498
Price changes in the last 24 hours: 0.17% increase
Price changes in the last week, 0.20% increase
7- Cardano
Price: $0.2599
Price changes in the last 24 hours: 0.39% decrease
Price changes in the last week: 0.23% increase
8 – Dogecoin
Price: $0.07608
Price changes in the last 24 hours: 0.03% decrease
Price changes in the last week: 1.45% decrease
9- Polka dot
Price: $4.49
Price changes in the last 24 hours: 0.14% increase
Price changes in the last week: 0.85% increase
10- Solana
Price: $11.38
Price changes in the last 24 hours: 0.17% decrease
Price changes in the last week: 0.56% decrease