Keeping the portfolio of stock markets from the total index – Tejaratnews
According to Tejarat News, the start of trading on Tuesday, April 15, was enough for the stock market index to reach the highest peak recorded in its history in the first 20 minutes of trading among stock market participants, after 968 days after the sharp fall in August 1999.
Portfolios and stock market baskets have something else to say. When you listen to the words of some shareholders, you quickly realize that not all stock exchanges are happy with this ceiling breaking. They believe that their portfolios and baskets did not earn returns as the total index reached its ceiling and managed to break it.
When looking at the list of symbols that are still far from their historical ceiling in 1999, it can be said that out of 750 existing symbols, 500 symbols have not reached their historical ceiling and about 250 symbols are more than 50% behind their historical ceiling!


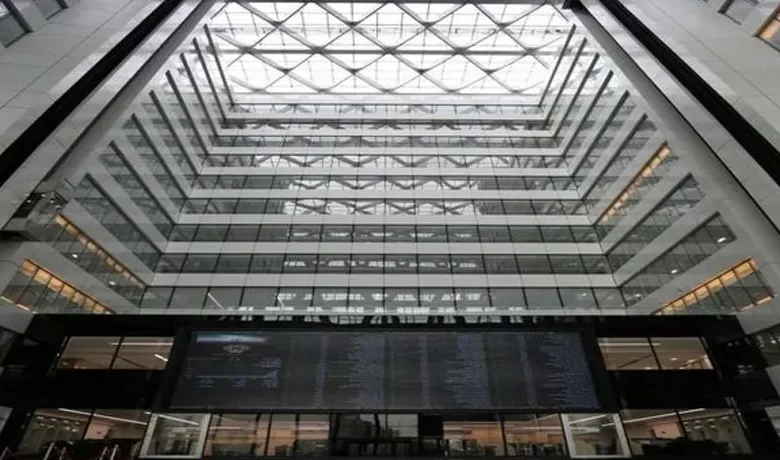
For example, some of the stock market baskets that kept their baskets before the fall of 1999 and did not have many exchanges, have not been able to close their roof like the main figure of the glass hall, and their losses are still continuing.
But where should we look for the reason for this? Has indexing been done during the last year or rather in the past years? Or maybe the index calculation formula is facing a serious problem to show the reality of the market! We can also raise this question: Has the way of arranging the portfolio of the stock exchanges caused them to remain behind the market efficiency?
The reason for the lower efficiency of the stock market portfolio compared to the total index
In the last month and a half, the total index has grown well. But this growth happened in the form of several days and short-term periods due to the growth of some symbols; For example, for a few days, Foulad and Femli would cause the growth of the index, and in the following days, refineries would become the wing of the index for the flight of several tens of thousands of units.
Although we don’t see extensive and deliberate indexing in the Tehran Stock Exchange like in the past, there are still some forms of indexing. In a trading day, the majority of the market may be negative, but due to the flow of demand in a group, and more precisely, two to three indicator symbols from important market industries such as basic metals, automobiles, and petrochemicals, the main indicator of the glass hall will turn green.
Experts believe that the equal weight index is a better measure for measuring the real growth of the market, but the equal weight index itself is also subject to criticism such as cash profit.
Comparison between the dollar index of the Tehran Stock Exchange and the ceiling of the summer of 2019
Currently, the dollar value of the capital market has reached half of its value in August 1999. The dollar value chart of the capital market was also under the shadow of a strong downward trend line in a downward trend.
In 1999, certain conditions prevailed on the capital market, many experts still believe that the rise that the stocks had and the prices that the symbols experienced were accompanied by a large bubble. Therefore, this question arises in the minds of capital market activists, whether the comparison between the current dollar index of the market and the ceiling of 1999 will be evaluated as the right thing to do?
In the financial markets, when the market finds a trend, some parts of the market may experience overreaction or a bubble, but it is not fair to talk about the bubble in the whole market. Also, even if the prices in 1999 were for a portion of the market, it is no longer a bubble now with parallel asset growth over a period of 2 years and a few months. For example, the price of a car like Pride looks much more bubble compared to the shares of listed companies! Or in another example, we can refer to the price per square meter of an apartment, which in terms of price is equal to the price of housing in many advanced countries of the world.
Therefore, it makes sense to evaluate whether an asset is a bubble or not compared to other parallel assets.
Read more market analysis reports on the stock market news page.