Likely to fall to $ 0.5

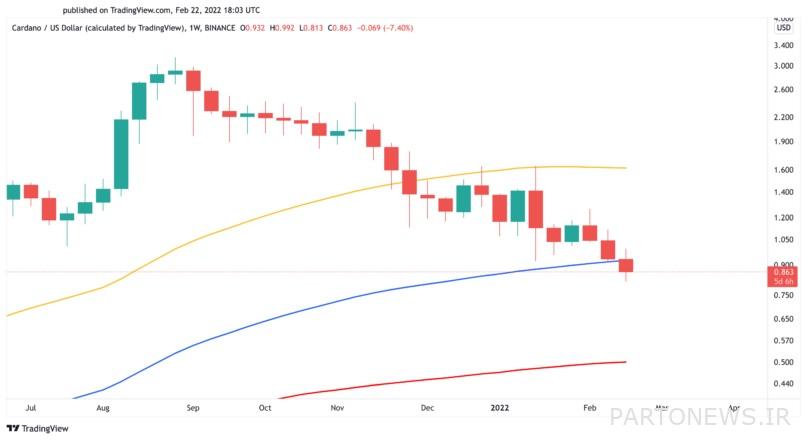
As can be seen from the in-house data, most of Cardano’s hold units have been purchased at current prices above current levels. In addition, the one-week view of the Cardano market shows that the 100-week moving average, which is the main support for the price, is on the verge of breaking.
To Report Crypto Briefing, Cardano is more than 74% away from its all-time high of $ 3.16 in early September 2021. Although Cardano’s recent crash seems large enough, intra-chain and technical indicators indicate that further price declines are likely.
Cardano appears to have lost a vital level of support that could lead to a sharp price correction.
In the last two weeks, about 35% of the market value of Cardano, which has been dubbed the “Atrium Killer”, has been lost, and the price has dropped from $ 1.26 on February 8 to the lowest level in 2022, 0. Reached $ 81. Despite the significant losses that Cardano has suffered, this digital currency may face another downturn.
The Investors’ Profit and Loss Index (IOMAP), presented by IntoTheBlock’s, shows that Cardano has lost a vital driver of demand. Nearly 63,700 addresses have purchased more than 1.4 billion Cardano units in the past at an average price of $ 0.96. Now that Cardano prices have fallen below this support area, signs of weakness in the trend could encourage market participants to sell their assets to avoid further losses.
The IOMAP index actually shows how many units of a currency have made a profit for their holders and how many have made a loss.
As the index shows, Cardano has no significant level of support in its downward trajectory, and another downtrend could lead to a significant downturn.
From a technical point of view, a descending hypothesis is more likely; Because Cardano, the seventh largest digital currency in terms of market value, has lost its 100-week moving average (MA) as its key support level. The current weekly candle is not yet closed below this moving average; But for now, there is a very pessimistic outlook for it. The 200-week moving average indicates the next support level at $ 0.50.

Due to the lack of support, monitoring this weekend (until next Sunday) is necessary to confirm the loss of the 100-week moving average. If the price can return above this index, Cardano could potentially prevent a fall of up to $ 0.5. In addition, it may even gain the strength to return above the 50-week moving average at $ 1.6.

