Losses for long-term Bitcoin holders are mounting; A sign of trend change?

The exit of about 2 trillion dollars of capital from the market after the end of the upward trend in the last 9 months brought a sharp drop in the value of Bitcoin and other digital currencies. However, it is still not possible to say with certainty whether the market has reached the end of its down cycle or not. In this situation, examining the behavior of long-term investors can help us find the answer to this question.
To Report CryptoSlate’s analysis of such (on-chain) data shows generally positive sentiment among long-term Bitcoin investors. However, comparing the index The amount of bitcoins in loss Compared to the previous years, it means that the price of Bitcoin has not reached its lowest point yet.
The volume of bitcoins at the loss of long-term holders
Long-term holders (LTH) are those who have held their bitcoins for more than 155 days. Based on historical data, the surrender of long-term holders of Bitcoin has usually been associated with the lowest price or bottom of each market cycle.
The chart below shows the amount of assets at a loss for long-term Bitcoin holders over the past 11 years. When, in 2015, 2019 and 2020, the number of bitcoins lost by these holders exceeded 5 million units, the upward trend of the price started shortly after that.
The indicator of the volume of bitcoins in the loss of long-term holders is approaching this threshold; However, it has not yet gone beyond that. This shows that the market has not yet reached the end of its downtrend and Bitcoin investors should wait for more time.
Gains and losses of return bands
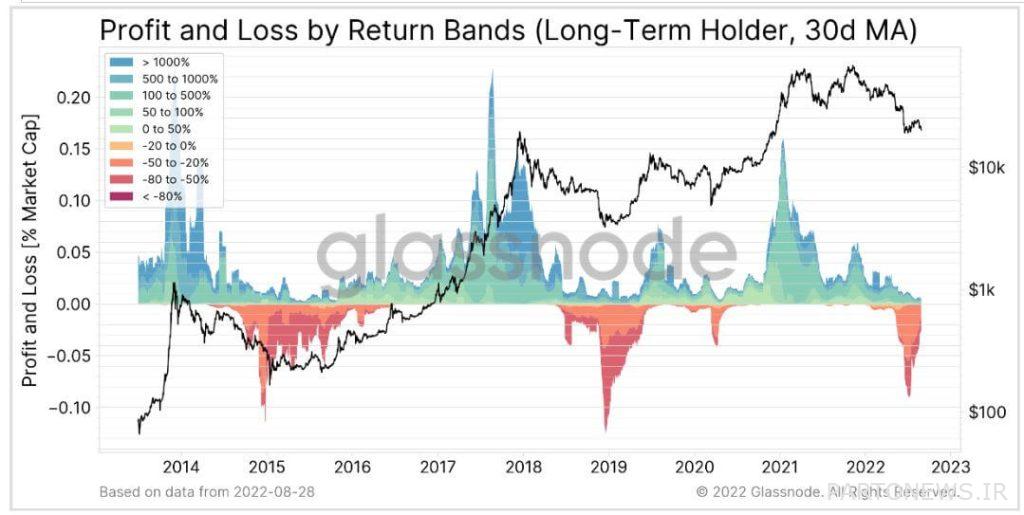
The Profit and Loss by Return Bands indicator depicts the pain that long-term holders of Bitcoin are currently enduring. This index shows the spending behavior of different market groups, which are divided into different color bands according to the amount of realized profit or loss.
This data is presented as a percentage of the market value. For example, a positive 0.5 indicates that the total realized profit of long-term holders was equal to 0.5% of the total market value of Bitcoin at that point in time.
This profit or loss is calculated by multiplying the value of Bitcoin by the selling price minus its purchase price in dollars. Then, these calculations are performed for all spent coins and added together to divide into return bands.
The chart below shows the depth of the surrender zone for long-term holders. However, the lower band level is currently around negative 0.07. This figure is still far from negative 0.12 in 2015 and negative 0.14 in 2019.

Changes in the balance of long-term holders
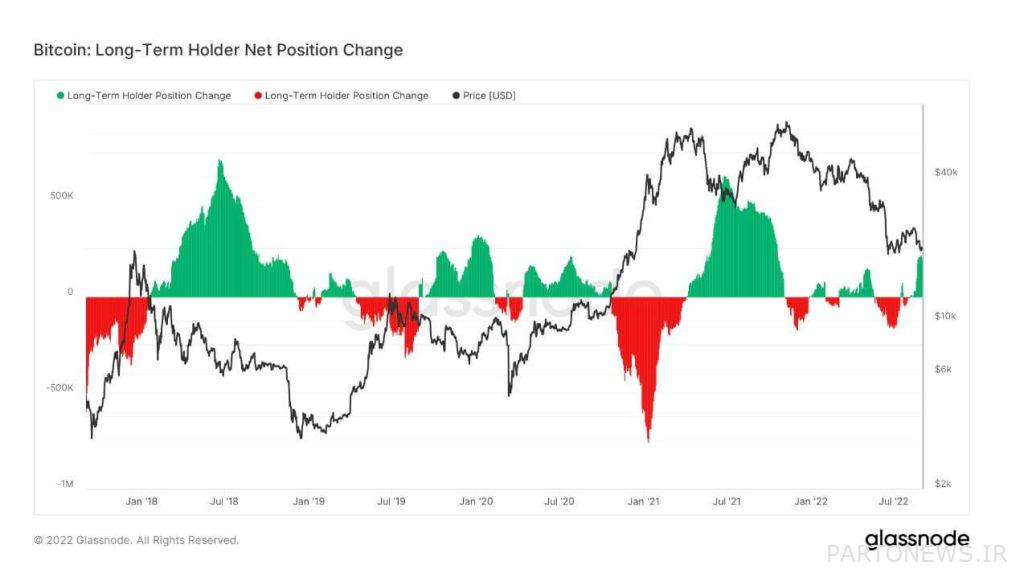
Net changes in the balance of long-term holders refer to the distribution of cashed tokens of long-term holders or the accumulation of new tokens by them.
The chart below shows the changes in the distribution or accumulation of long-term holders’ inventory in 2022, which is less compared to previous years. This chart shows the high distrust of long-term investors in the market in the midst of bad macroeconomic conditions.
Accumulation of long-term Bitcoin holders in August has reached its highest level since the beginning of 2022. In terms of long-term sentiment for Bitcoin, this behavior could be an encouraging sign.


