Luna’s glow and the return of Thezos; Top 5 digital currencies of the week from the point of view of analysts

The strong revival of the Bitcoin price in recent days, reaching $ 49,000, caused the sentiment in the market to rise again. The rise of bitcoin has given digital currencies such as Luna, Kazmas, Thezos and Atrium a better chance in the short term.
As can be seen by looking at the fear and greed index data, the sentiment in the digital currency market is changing rapidly; The index was in the range of extreme fear on Thursday and has reached the neutral range today. As the price of Bitcoin approaches the $ 50,000 psychological resistance, it is likely that market sentiment will continue to rise.
The decision of the US Securities and Exchange Commission (SEC) regarding Bitcoin exchange traded funds (ETFs) could be an important factor in improving the market uptrend. The commission recently announced that it would extend the decision-making period for licensing these funds by another 45 days. Meanwhile, some experts, such as Eric Balchunas, Bloomberg’s chief analyst on stock exchange-traded funds, say the delay in the US Securities and Exchange Commission’s announcement of its vote may signal a green light to bitcoin ETFs in the middle of this month. AD.
Balchunas cites SEC chairman Gary Gensler as backing negotiable funds backed by futures contracts, and says the chances of them being licensed in mid-October are about 70 percent.
Bitcoin (BTC)
Bitcoin traded above the 50-day moving average (SMA50) at $ 46,633 on Friday. Sellers are looking to stop the resistance at $ 48,843.2. Earlier, however, buyers were not allowed to fall below the simple 50-day moving average, which is a positive sign in itself.
The 20-day moving average (EMA20) is upwards at $ 45,141 and the Relative Strength Index (RSI) is in the positive range, indicating that buyers are superior in the market. If they can push the price above $ 48,843.2, one can expect a rise to $ 52,920.
This area is likely to act as a heavy resistance, but if buyers can cross the barrier, the head and shoulder pattern will be invalidated. In that case, as the uptrend accelerates, the price can be expected to reach $ 60,000.
On the other hand, if the price falls below the current level and falls below the moving averages, it will indicate that reaching higher levels will increase the sellers’ thirst for sales. In this case, it can be said that the price will probably go down to $ 40,000.
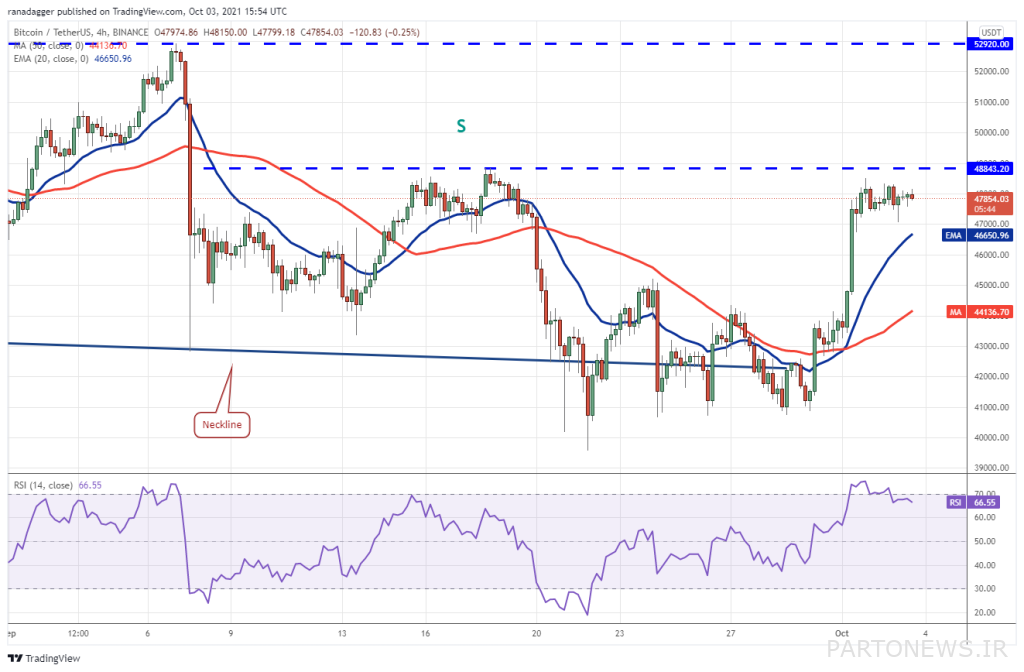
At 4-hour timeframe, both moving averages have an uptrend, and the relative strength index is near the saturation zone; This means that you are more likely to climb than to fall. The price has been trading in the time frame for $ 47,000 to $ 48,495 for some time.
If buyers can push the price above $ 48,843, one can expect the price to reach the $ 50,000 psychological resistance. The next target in this trend is $ 52,920.
On the other hand, if the price falls and closes below the 20-day moving average, it can be said that short-term traders are looking to withdraw their profits from the market. This can lead to a drop to $ 45,000 and even a simple 50-day moving average.
Atrium (ETH)
Atrium prices managed to grow by 11.77% yesterday. This growth offset last week’s losses.
In order to break the $ 3,679 resistance, Atrium must maintain Fibonacci 23.6% at $ 3,369. $ 3,679 is one of the main resistances facing Atrium.
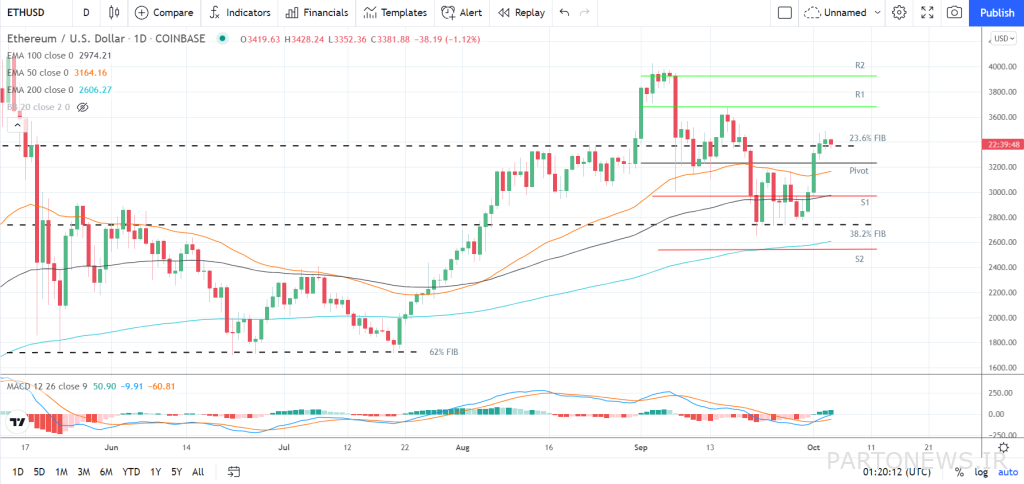
As mentioned earlier, the growth of Atrium requires the uptrend of other market currencies. If there is an upward pressure, you can expect to cross $ 3,500. On the other hand, it should not be forgotten that sellers are likely to strongly defend the $ 3,679 resistance.
Fibonacci 23.6% at $ 3,369 and $ 3,230 are the support that Atrium sees behind it. If this support is passed, the next possible destination will be $ 2,972.
Atrium’s second major support is at $ 2,523. A sharp increase in sales pressure in the market may pave the way to reach this area.
Luna (LUNA)
The price of Luna, the Terra Protocol digital currency, reached the top of its downtrend on Saturday, and yesterday buyers managed to record a new historical high above $ 45.01. However, the high candle of that day shows that the sellers are looking to defend the $ 45.01 resistance.
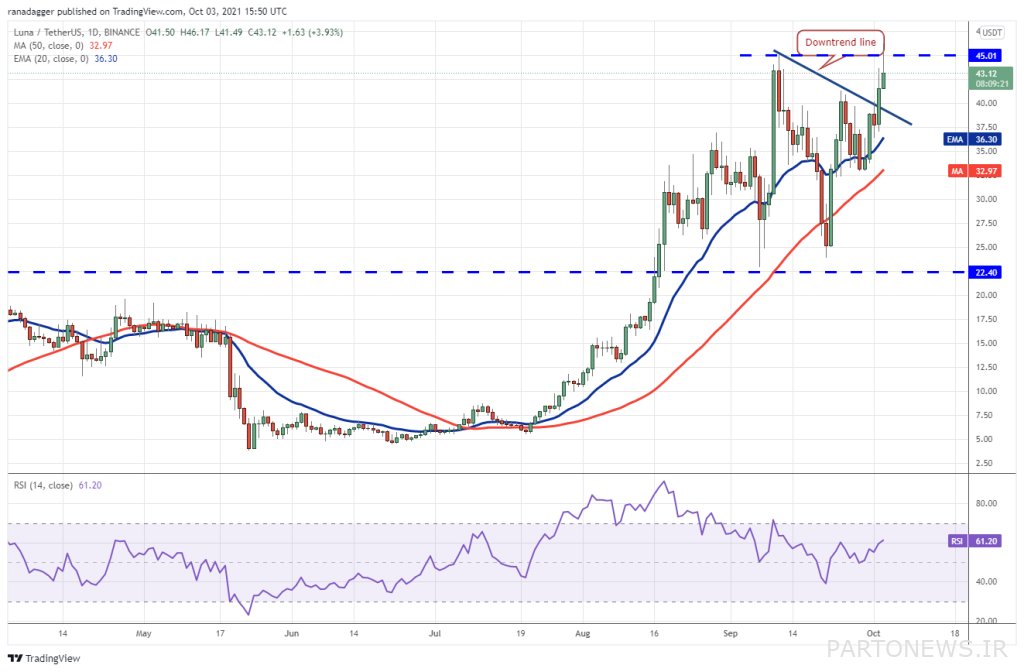
If the price falls below the level, but recovers in the downtrend line, it means that the sentiment in the market is still positive and buyers are buying on the floor.
In that case, buyers will once again try to push Luna above $ 45.01 and $ 46.17. As the price crosses this resistance range, a new uptrend can be predicted. $ 50 resistance can also be a heavy resistance, and if you cross it, the way will be opened to reach $ 65.
On the other hand, falling below the 20-day moving average (EMA20) at $ 36.30 could lead to a fall to the simple 50-day moving average at $ 32.97. Breaking this support would mean that market control is out of the hands of buyers.
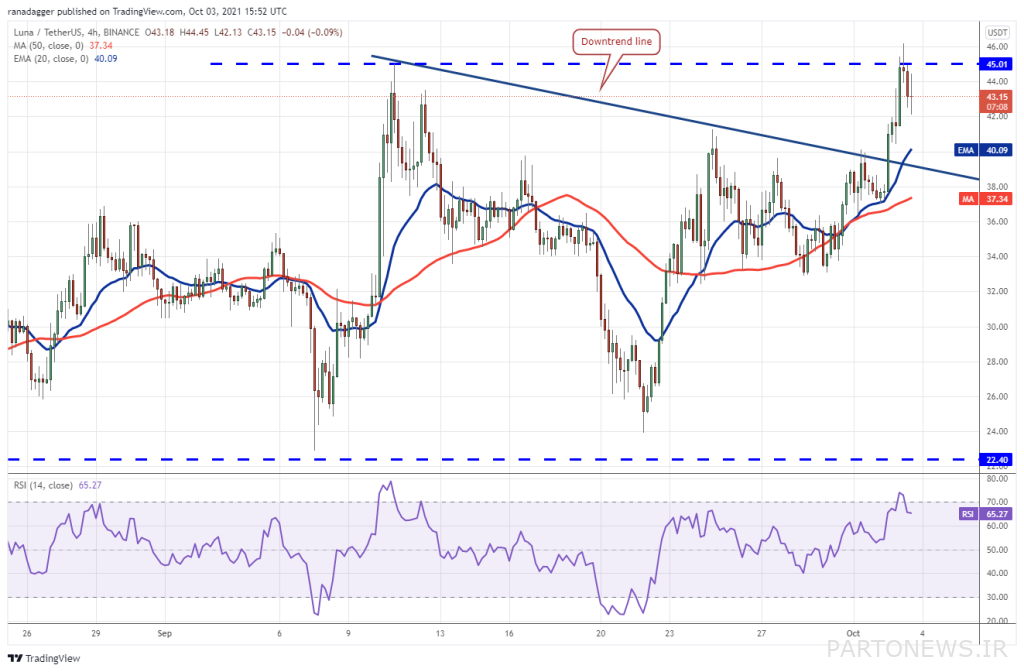
Despite the price crossing of $ 45.01, the high candle of Kendall shows that the selling pressure has been high. Sellers are currently looking to catch offensive buyers who were bullish at $ 45.01.
The 20-day moving average is the first support for Luna’s price. The price recovery from this support indicates that market sentiment remains positive. In this case, buyers will try to push the price above $ 46.17.
In addition, falling below the 20-day moving average may reduce the 50-day moving average. If this support is broken, there is a possibility of further reduction to $ 33.
Kazmas (ATOM)
The Kazmas price jumped from $ 32.32 on Wednesday, indicating that buyers are buying on the floor and market sentiment remains positive.
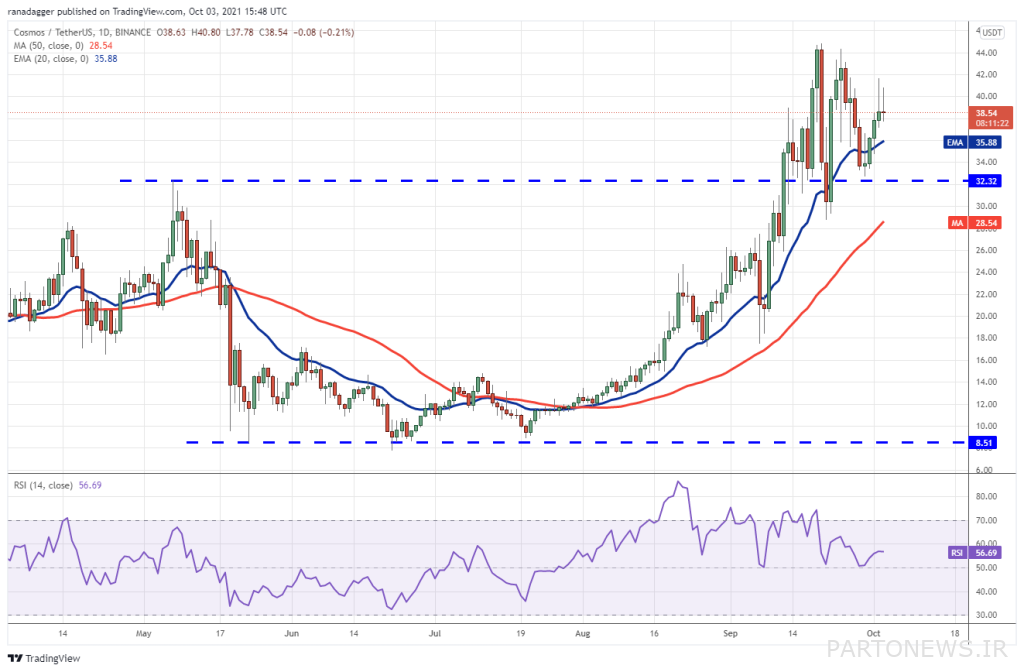
On Thursday, buyers pushed the 20-day moving average above $ 35.88, but failed to accelerate. This shows that the sellers have not yet surrendered and are selling at every rally. Buyers are expected to raise the price above $ 44.8 and stabilize it to resume the uptrend.
Kendall’s high joy yesterday shows that the sales pressure is high at higher levels. If the price falls below the current level and falls below the 20-day moving average, sellers will once again try to bring Casmas below $ 32.32. If they succeed, we may see the price fall to the simple 50-day moving average at $ 28.54.
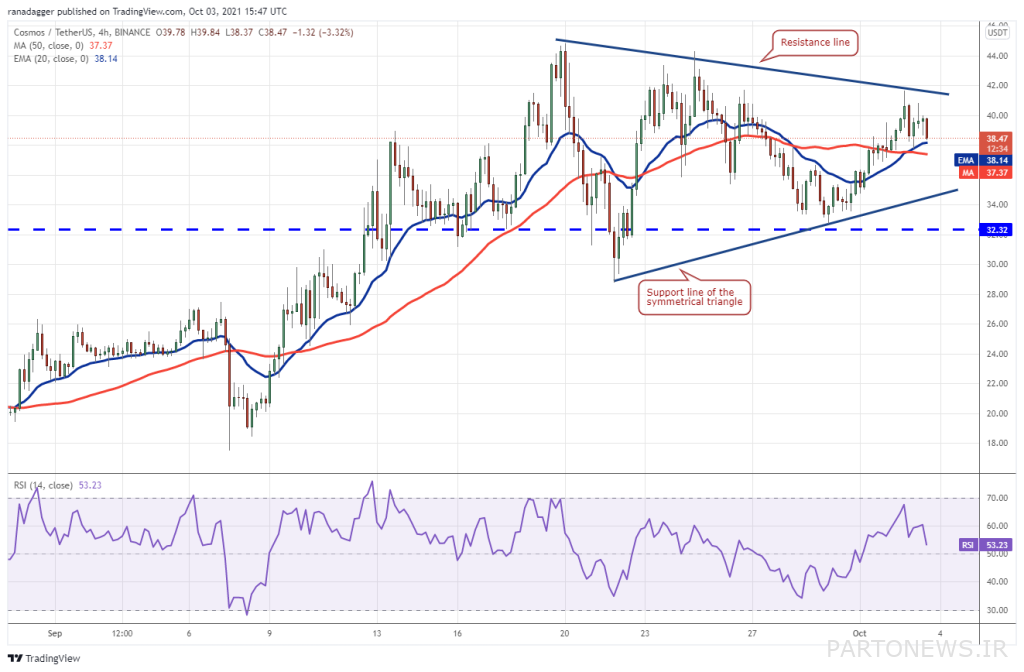
In the four-hour time frame, the price fell from the resistance of the symmetrical triangle pattern, which shows that the sellers are strongly defending this area. If the price recovers from moving averages, buyers will once again try to push Casmas to the top of the triangle.
Their success could lead to a rally of up to $ 44.8. The next goal is $ 50 psychological resistance. Closing the price above this level will open the way for another climb to the target of $ 57.61.
On the other hand, if the price falls above the moving averages, the next possible destination will be the pattern support line. Breaking this support may lead to $ 28.83 and then $ 24.5.
Theus (XTZ)
The price of Tzus jumped to $ 5.5 on Wednesday from the simple 50-day moving average. Acceleration accelerated after buyers pushed the Thesos above the 20-day moving average above $ 6.4.
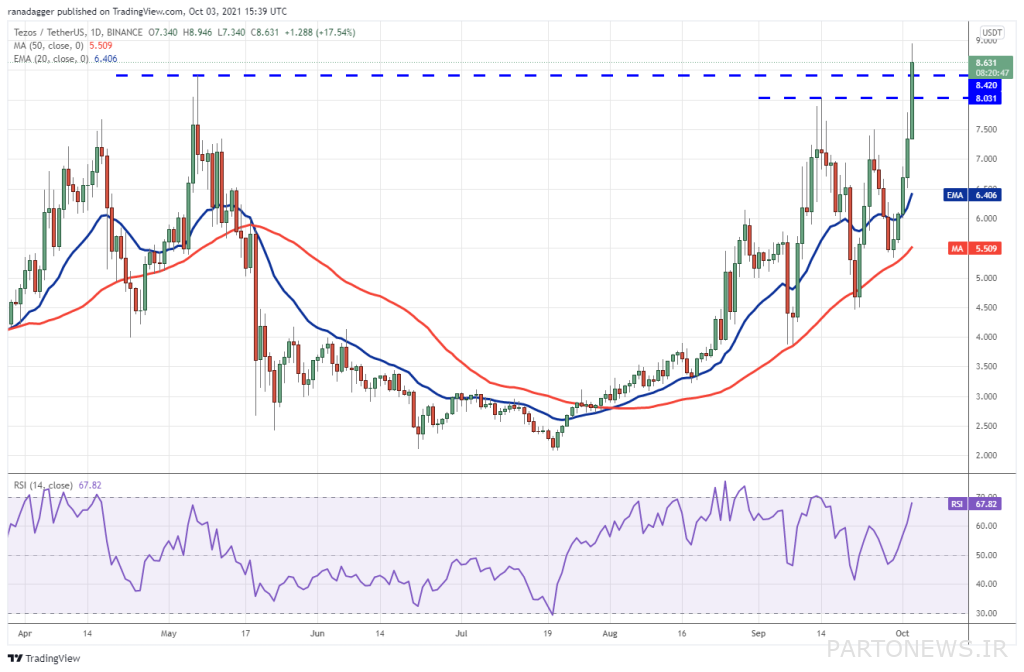
The stabilization of the uptrend pushed the price above the resistance range from $ 8.03 to $ 8.42. Currently, both moving averages have an upward slope, and the relative strength index is in the range of buying saturation, which indicates that buyers have more power in the market.
If buyers can stabilize Tzus above $ 8.42, we can expect a new uptrend. On the other hand, if sellers lower the price below $ 8.03 and stabilize there, it means that they are taking their profit out of the market at higher levels. In this case, there is a possibility of reducing the price to the 20-day moving average.
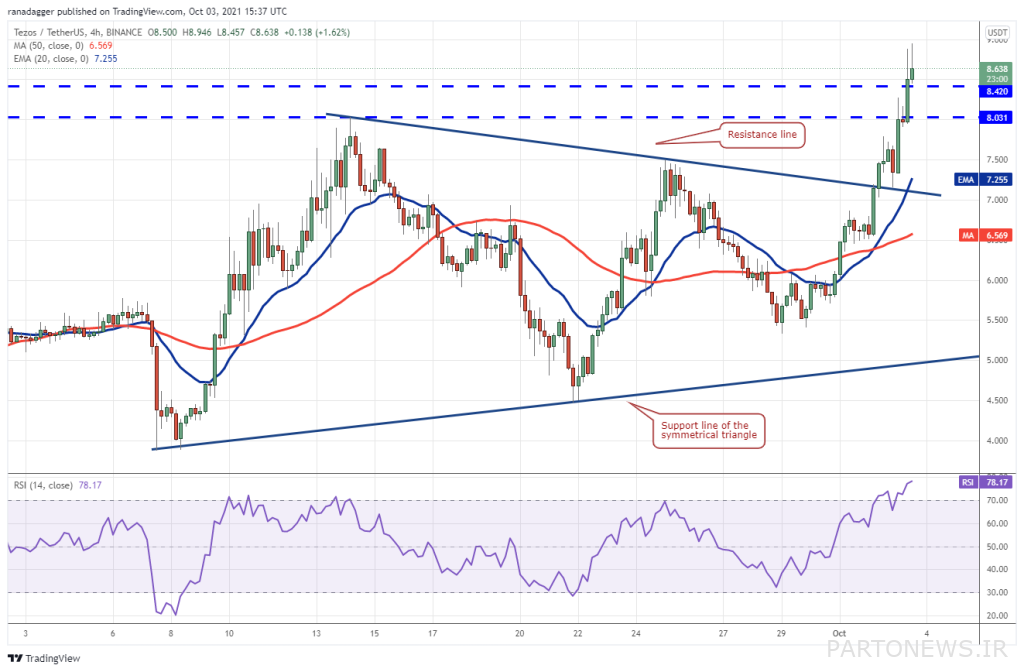
The 4-hour timeframe indicates that a symmetrical triangle is forming. This pattern is usually a pattern of continuity. Earlier buyers were able to defend the level from which the jump began, which indicates that another uptrend has begun.
The target for this template is $ 11.33. The uptrend of the 20-day moving average and the relative strength of the buy-in index indicate that buyers have more control over the market.
Closing below $ 8.03 will be the first sign of a weakening uptrend. This may pave the way for a 20-day moving average again. A strong price recovery from this level will indicate that the sentiment in the market is still positive and buyers are buying on the floor. On the other hand, breaking below the 20-day moving average is likely to bring down $ 7 and then $ 6.5.

