“Market Depth Chart” is a new Easy Trader tool useful for stock traders
According to the circular of the Stock Exchange and Securities Organization, from April 6, 1401, all price quotations of shares were displayed. Displaying all quotes is a possibility through which traders can be informed of the volume and price of all registered orders of a share.
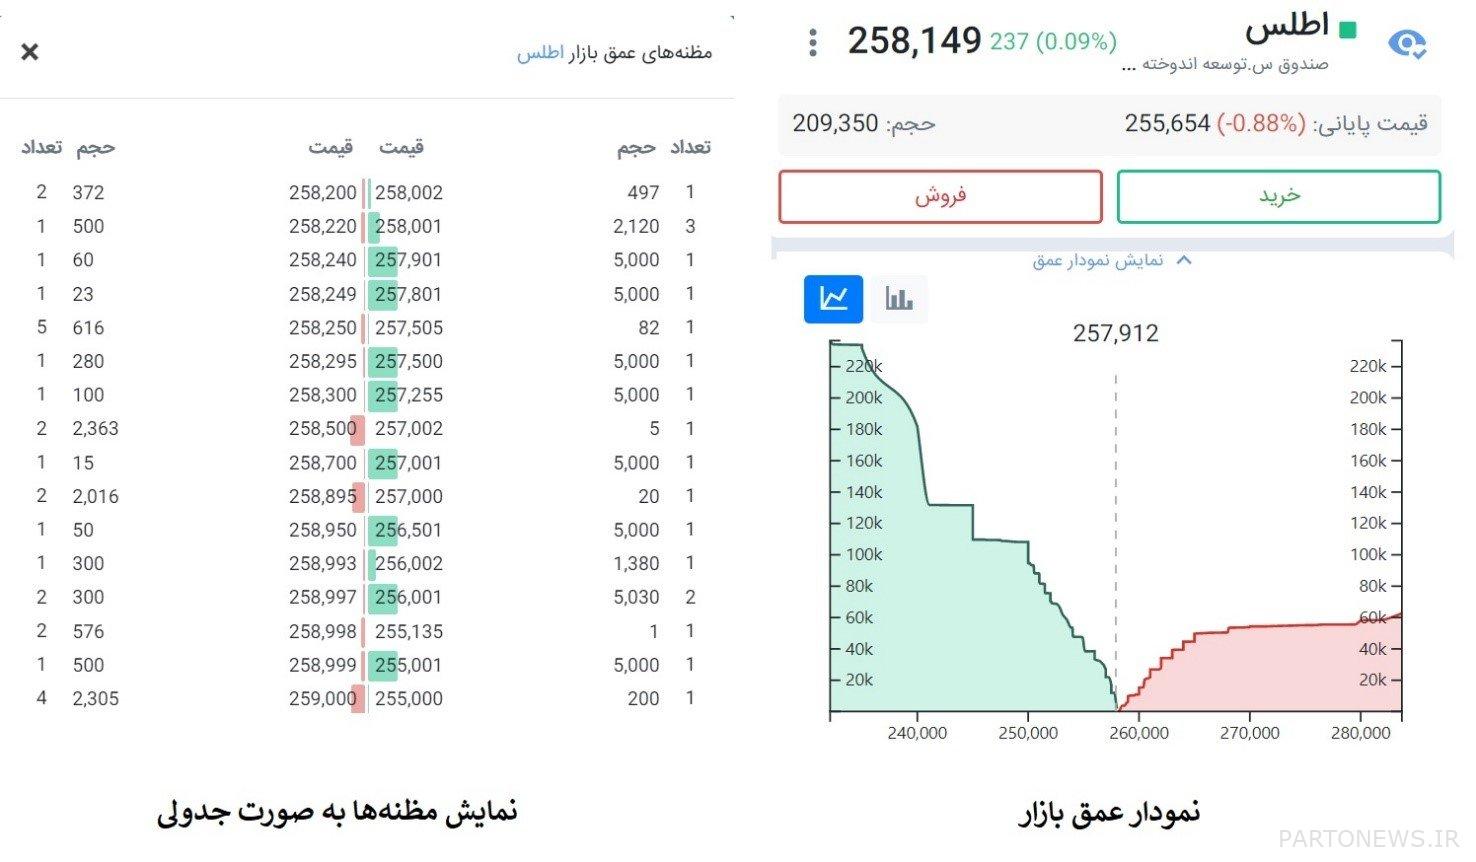
Mofid brokerage from April 6, 1401 in Easy Trader system, in addition to displaying all quotes, which was done according to the exchange organization directive, also provided “Market Depth Chart” as a dedicated service and tool for easier analysis of quotes.
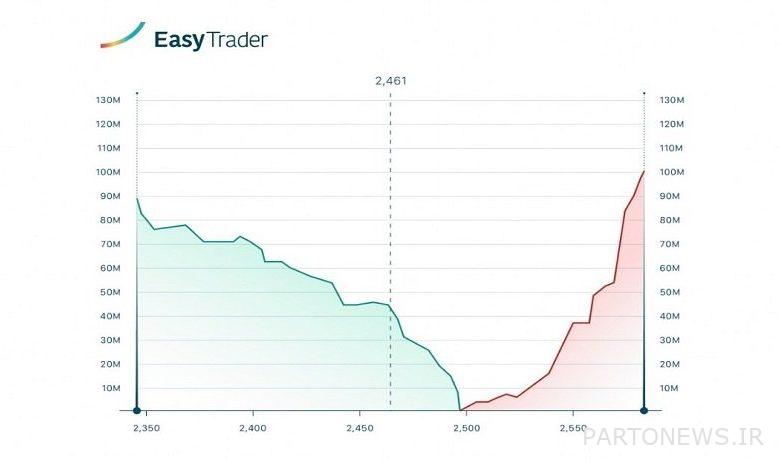
The “Market Depth Chart” simply displays all quotes and an overview of all orders related to a stock with an attractive design that displays more analytical information than tabular quotes.


In the “Market Depth Chart”, the horizontal axis represents the price and the vertical axis represents the cumulative volume of orders. The market depth chart provides traders with advantages such as identifying support and resistance, liquidity of securities, aggregate supply and demand, the difference in buying and selling prices, and..
The “Market Depth Chart” also facilitates the detection of support and resistance of the symbols, this chart allows traders to identify the fear order (false sell) and support order (false buy).
Using the “Market Depth Chart”, it is possible to see the difference between buying and selling in the match price and to better identify the amount of liquidity, supply and total demand in the desired symbol.
For more information and familiarity with these two new services, you can refer to the related educational article This link See.