Polygon Price Analysis: MATIC’s Chances to Jump Up to $1

Polygon now has a chance to continue its recent uptrend to $1; The level that was last seen about two months ago in the market of this digital currency.
To Report CoinDesk, Polygon experienced a 12% growth over the past week, which led to an increase in the price of this digital currency to $0.90 and provided a firm foothold above the 200-day simple moving average (MA 200) for buyers. Breaking the resistance of the 200-day simple moving average is a positive signal for a change in the direction of the price movement.
On the one-day view of the Polygon market, the Ichimoku cloud indicator, which consists of a series of lines to show the trend and direction of price movement, has also just been broken. Analysts consider the crossing of the price candle above or below the Ichimoku cloud as an early sign of an upward or downward change in the market trend.
Katie Stockton, founder of Fairlead Strategies, says:
Polygon has just passed the Ichimoku cloud resistance and the 200-day simple moving average. This upward breakout reflects short-term bullish momentum and should end with buyers’ support pushing the price up to the $1 target. After this level, it is time for the next resistance at $1.31.
Also read: What is the Ichimoku Cloud? Teaching how to use technical analysis
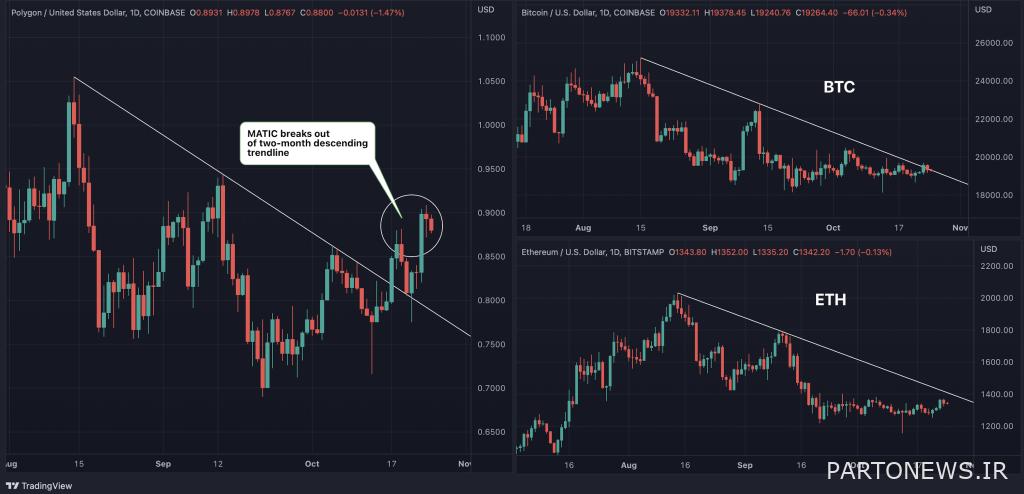
In addition to the resistances discussed above, Polygon has just broken a downtrend line to the upside. This downward trend line connects the peaks of September and August price.
Mark L. Newton, head of technical strategy department of FS Insight, said about this:
Palgian has made a completely upward move and has broken the downward trend line that has been going on since August this year. A similar trend line exists on the chart of Bitcoin and Ethereum, with the difference that these two digital currencies have not yet managed to cross above it. The continuation of this upward movement above $0.86 can bring the price to $0.95 and then $1.05.

Polygon’s jump above this key trend line is in stark contrast to the lackluster trend of Bitcoin and Ethereum in recent days. Because as it was said, these two digital currencies have so far failed to cross this price resistance.
According to Stockton, Bitcoin’s daily candle needs to close above the 50-day simple moving average at $19,576 for two consecutive days before the short-term price trend is bullish.

