Technical analysis and construction / important supports and resistances of the share – Tejaratnews

According to Tejarat News, Iran Construction Investment Company was established in July 2015. The main activity of this company is investing in stocks, investment units, funds or other securities in order to operate in the fields of production, development, trade and commerce and contracting in the housing, building, residential, office and commercial sectors.
The shares of this company were offered in Tehran Stock Exchange in April 1980 at a price of 100 Tomans.
The capital of the company at the time of the initial offering was 11 billion tomans, which after several stages of capital increase reached 384 billion tomans.


Construction with a market value of five thousand and 591 billion tomans is traded in the mass production, real estate and real estate group of the stock exchange.
Mehr Aindegan Financial Development Group Company is the largest major shareholder of this company by taking possession of 22.7% of the shares.
Hamon Kish Investment Company and Petrochemical Industries Investment each acquired 17.65 and 13.97 percent of the shares of Iran Construction Investment Company respectively.
It should be mentioned that 39% of the company’s shares are also considered floating.
technical analysis
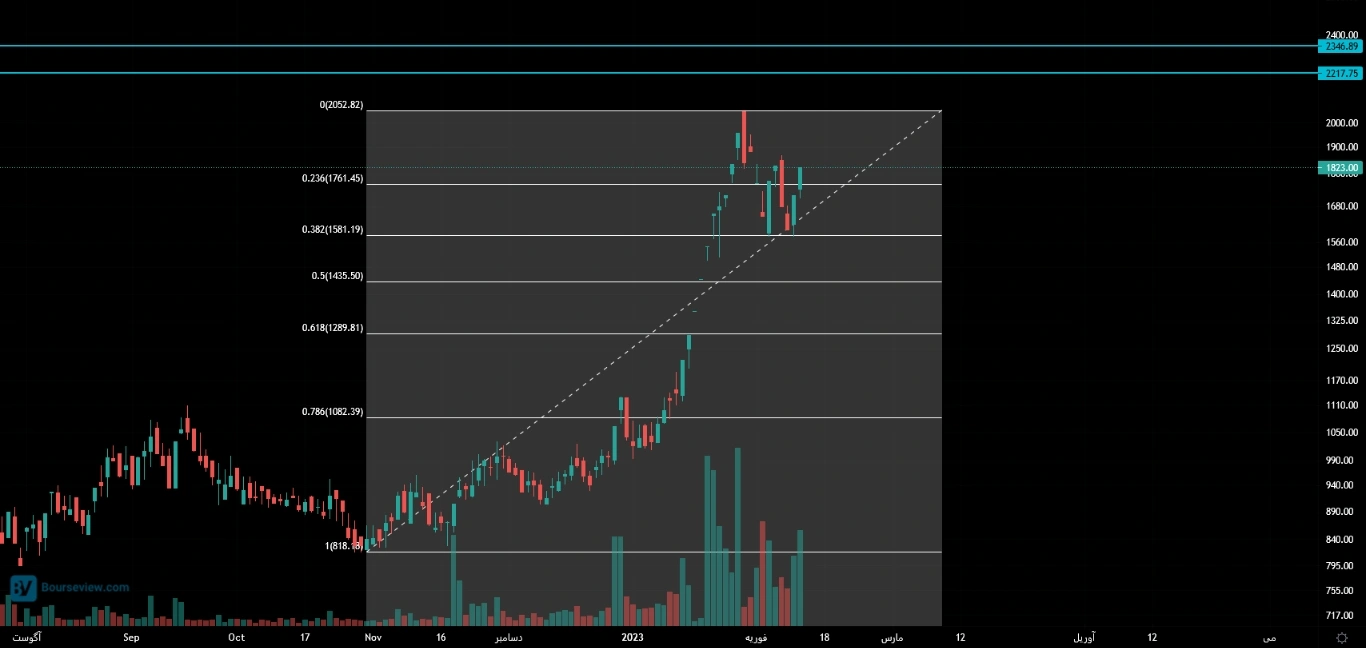
Examining the stock price chart of Iran Construction Investment Company shows that this share experienced a big jump after breaking its powerful downward trendline that was formed from September 1400 to December this year.
As it is clear in the chart, the downward trendline that was formed since Shahrivar 1400 was of high credibility with the share hitting four times. So that every time the candles collided with this trendline, the structure experienced a drop of about 35%.
Seranj M Sahm was able to break this powerful trendline on the 5th of December this year, and after a pullback, it reached the level of 207 Tomans with a 120% spike on the 20th of the same month and ended its erosion downward trend.
Analysis of the price chart shows that after reaching the level of 207 Tomans, the share corrected to 160 Tomans, which is considered an important support level for the share.
It should be mentioned that if Vasakhan loses this level, other important static supports are 124 and 96 Tomans.
The resistance in front of the share is 247 tomans after 207 tomans, which is also the historical ceiling of this share.
By drawing a retracement Fibonacci on the last rising log, it can be seen that the 0.38 level of this tool has prevented the continuation of the correction of this share.
If this level is lost, the balance of 50% of FIB at the price of 143 and the balance of 61% of this tool at the price of 128 Tomans are other supports for this share.
Fibonacci extension also informs about the resistance of 221 and 234 Tomans at the levels of 150 and 161 percent of this tool on this upward movement and its correction.
Read more reports on the stock news page.