Technical analysis of Arfa in July 1402 / Has Arfa stock flight started? – Tejarat News

According to Tejarat News, based on the quarterly performance report of Arfa Iron and Steel Company, in the first quarter of this year, the company recognized a profit equal to 65% of last year’s net profit. Also, the company’s profit this spring has increased by 20% compared to the total profit of 1400.
Experts believe that strong quarterly reports like the one published by Arfa will moderate the symbol’s p/e. This, in turn, increases the value of the share. Currently, the symbol “Arfa” with a market value of 34,000 billion is traded in the second OTC market.
Arfa technical analysis
A look at the price chart of “Arfa” symbol shows that the share price has behaved in a channelized manner during the last three years. This means that the price has progressed in an ascending channel with a low slope, and by hitting the ceiling and bottom of the channel, a turn has been created in its movement.


The good performance of Arfa Fould and Iron Company was also reflected in its chart. In this way, since November of last year, when the upward trend of the stock market began, it has returned to its path after a short correction.
Currently, “Arfa” has crossed its historical ceiling in the summer of 1400 and has sweetened the taste of its shareholders by achieving a return of 199% since November of last year.
“Arfa” from a closer view
In a closer look at the Arfa chart, price compression is evident in the form of a collapsing triangle. Arfa stock price has entered this pattern with a sharp upward lag, which, along with compression, evokes the flag pattern in the minds of technicalists.
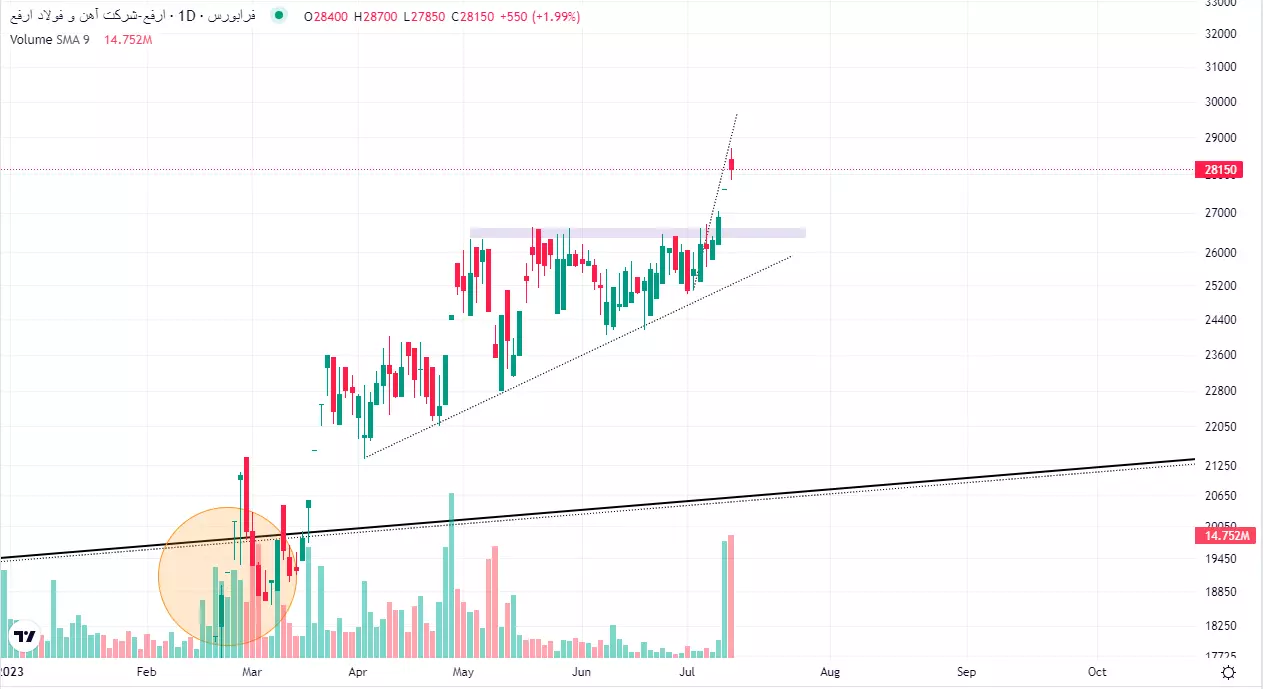
After the publication of the quarterly report on the last day, this company was favored by the people of the market. Because of this, the value and volume of Arfa transactions increased significantly while the market was in recession. Due to the liquidity entered in this symbol, the share managed to cross the ceiling of the triangle with the buying queue. Classic technicals declare the flag pattern’s objective to be the price growth of the size of the flagpole. Therefore, it can be considered as the primary goal for the “Arfa” symbol.
However, the flow of Arfa transactions decreased slightly compared to the beginning of the day, and this caused the mid-week candle in the price chart of this stock to turn red. At the moment, the most likely scenario for the pullback symbol is a “lift” to the ceiling of the previous compression. After that, there is a lot of potential to achieve higher goals. Another price target that can be considered for the stock is double the long-term channel width of the stock.
Also, in this scenario, it is not expected that the control floor of 229 Tomans will be lost. Therefore, this range can be used as a loss limit.
Read more market analysis reports on the stock market news page.