Technical analysis of Ghadasht shares in August 1402 / technical alarm for shareholders
According to Tejarat News, shares of Dasht Margab company with a market value of 1,680 billion tomans in the second market Exchange is placed During mid-week trading, the power of “Ghadesht” sellers was twice the power of buyers.
Technical analysis of Ghadasht stock
The range of 4,500 to 4,593 tomans, which is marked with a red box in the Ghadasht stock price chart, has become the price barrier three times to penetrate to higher levels. On the other hand, during this period, when the price tried to break the mentioned price range, it has created higher floors from the floor side with the frequency of the black trend line.
This price behavior has caused a compression in the form of a triangle. The bad news for Ghadasht shareholders is that the bottom of this triangle has broken down. The suspicious thing that can be seen in the Ghadasht stock chart is the sudden and intense increase in the volume of transactions on August 16 of this year. Exactly the day that the price of this symbol, from a technical point of view, hit the bottom of the broken triangle pullback.


After this date, “Ghadesht” continued its downward trend and currently it has broken the last floor of the downward trend (the level of 2,600 Tomans). Therefore, the closest support in front of Ghadesht is the level of 50% of the previous large upward wave.
If this support level cannot stop the selling motivation of the suppliers, the balance of 61.8% of this tool is considered a strong stronghold for buyers.
Technical analysis of food group index except sugar
The upward trend of the stock market since November of last year helped the food group, except for sugar, to well cross the ceilings of its downward trend of two years and two months. The index of this group managed to cross its historical ceiling in the range of 81 thousand and 231 units during its upward trend.
From the middle of May until now, the improvement process of the food group has reduced more than 26% of the index height of this group. What are the potential ranges for the possible return of the food chain industry index?
The drawing of an Andrews fork in the direction of the upward trend shows that after the growth of the index to the middle line of the fork and penetrating to its higher levels, it has entered the corrective trend. Currently, from the point of view of wave counting, we are in the fifth wave of the corrective trend. Accordingly, there is a high probability that with the end of this kinetic lag, the correction process of the index will also end.
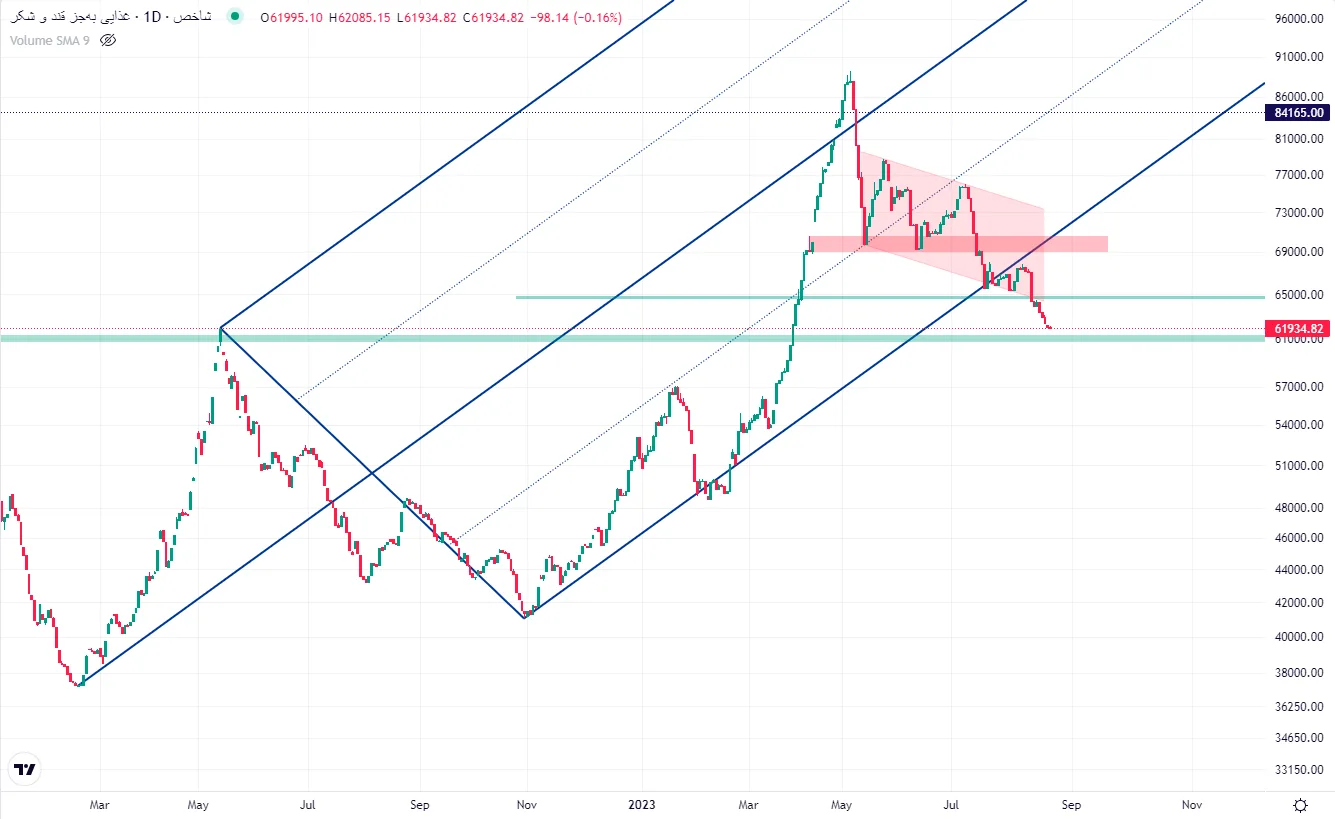
On the other hand, with the index moving 26% away from its ceiling in May of this year, the mentioned index is on the lower parallel of the fork. According to Andrews’ five principles, when the price reaches the fork lines, it is more likely to drain energy and turn than if the price crosses these lines. In the meantime, drawing a sliding parallel also helps to more accurately identify the return point.
If this support range fails to maintain the price, there is a static support range of 60,707 to 61,355 units, which was previously a strong resistance and prevented the index from crossing to higher areas twice.
Also, the correction process is a channelized food group icon, which can be framed in the red channel. The collision of the bottom of this channel with the lower parallel of the middle line has made an important energy point. Energy points have high attraction and repulsion properties. Accordingly, after the rapid absorption of the price, it can be expected that they will cause a possible jump in the price.
The retracement Fibonacci drawing on the starting and ending point of the big uptrend of this industry’s index shows that the indicator is near the 50% level. The intersection of the mentioned lines has built a strong stronghold for the index of the food group except for sugar in the range of 64 to 66 thousand units.
Disclaimer: All content included in this site is research, scientific and news and is not recommended for direct activity in any market.
Read more market analysis reports on the Capital Markets page.