Technical analysis of iron smelting on February 12, 1401 / will the upward phase of smelting begin? – Tejarat News
According to Tejarat News, in continuation of the production of steel products, with the launch of the steelmaking and rolling engineering department in January 1351, the smelting activity actually started with a capacity of 550 thousand tons per year. Finally, Zob Ahan Company of Isfahan was registered in September of 1953.
The main activity of this company includes smelting, casting and rolling of ferrous metals and alloy steels for the production of various standard engineering sections and sheet production.
Zob Ahan Isfahan is the largest steel company in Iran in terms of variety of products, which produces products such as construction and industrial steel sections with a capacity of over 3 million 600 thousand tons.


The shares of this company were offered in Tehran Stock Exchange for the first time in March 2010 at a price of 130 Tomans. Currently, Zob is traded with a market value of 19,307 billion Tomans in the basic metals group.
Meltdown since 1999
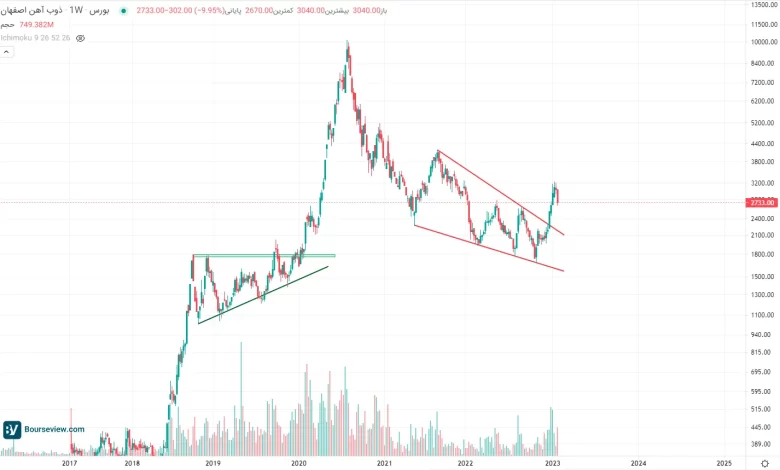
Examining the historical graph of Zob price shows that the price of Zob Ahn stock has gathered energy in a triangular compression between October 2017 and December 2018. After breaking the ceiling of the triangle in January 2018, the price entered the spike phase and managed to record its historical ceiling at the price of 1,000 Tomans.
In the historical fall of the stock market in 1999, Zob’s stock price was not spared from this collapse either. Zob experienced a decline of 83% from its historic peak during a downward erosion process that continued until November of this year.
This fall brought the melting to the area of the mentioned triangular roof. The return of the share to this range was the basis for the start of a new trend in which this symbol is currently located.
Technical analysis of melting
In the upward trend of the capital market that started in November of this year, the symbol “Zob” was able to experience a 92% increase in height within three months.
In the review of Zob’s price chart in the weekly time frame, this symbol has crossed its last downward ceiling, which was in the price range of 260 to 265 Tomans, and announced that a new phase has begun in the share price perspective.
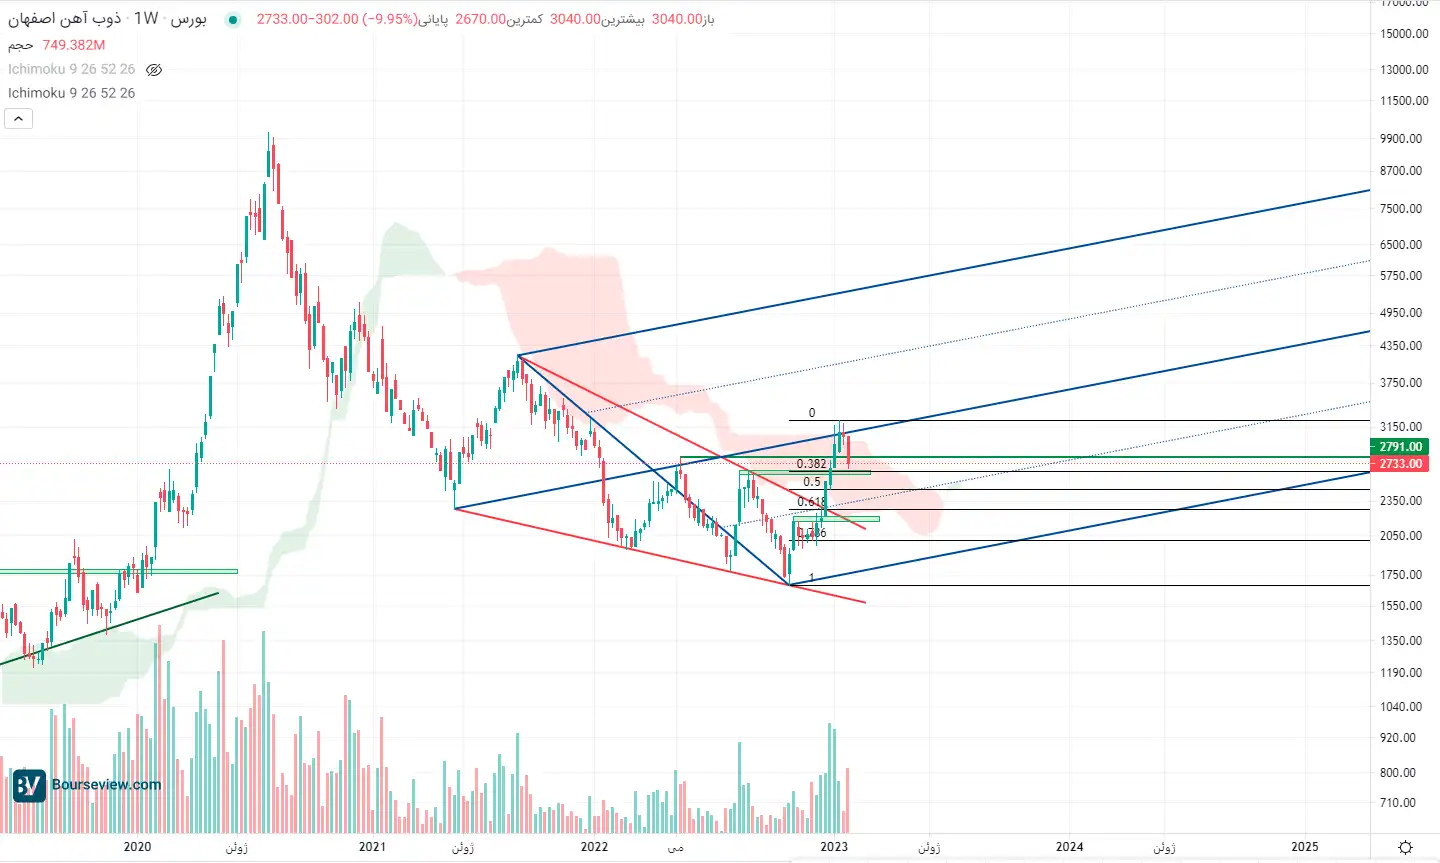
Now drawing a Fibonacci retracement on the stock’s last bullish log, it is evident that the first support for the meltdown is the 38.2 level of the Fibonacci retracement tool. This support for Zob is valid because it corresponds to the range of the last downward ceiling of the share, that is, the range of 260 to 260 Tomans.
If this valid range is lost, the 50% and 61.8% retracement Fibonacci levels are the next bastions to support the meltdown, and the price behavior in these ranges should be closely monitored.
During the recent upward trend, the Zob symbol has managed to get out of a downward corner.
The drawing of an Andrews fork shows that Zob has managed to advance to the middle line of the fork during the recent uptrend. The growth up to this range means that the buyers have managed to increase the price just as much as the ascending log that the melting symbol had in June to September 1400.
If the power of demand in the Zob symbol has the ability to cross the middle line of the fork, the way for the Zob symbol to reach the range of 410 to 420 Tomans, which was an important ceiling in the previous downward trend, will be paved.