Technical analysis of Packerman shares in August 1402 / Identifying the long-term goal of Barez Industrial Group shares

According to Tejarat News, Barez Industrial Group consists of several subsidiaries, including Kerman Rubber Industries Complex, Bazar Kurdistan Rubber Company and Sirjan Rubber Company.
Tamin Oil, Gas and Petrochemical Investment Company, which is active in capital market transactions under the symbol “Tapico”, is the major shareholder of this company with 50.2% of “Pekerman” shares. Also, National Development Group Investment Company, Middle East Bank Mutual Fund, and Makin Company are other major shareholders of Packerman.
Technical analysis of rubber and plastic index
The upward trend of the stock market started in November last year. The symbols of the rubber and plastic industry were not excluded from this trend. The upward trend continued until the middle of May and included two smaller corrective trends. However, in the technical analysis of the index chart of this industry, the size of the downward wave before the start of the downward trend is used. The reason for this is the similarity of the size of the chart correction from the middle of May until now to the size of the last downward wave before the beginning of the upward trend.


By drawing a Pullback Fork, you can guess potential reversal points. Drawing a parallel sliding near the midline of the pullback fork introduces an important retracement level to the technicalist.
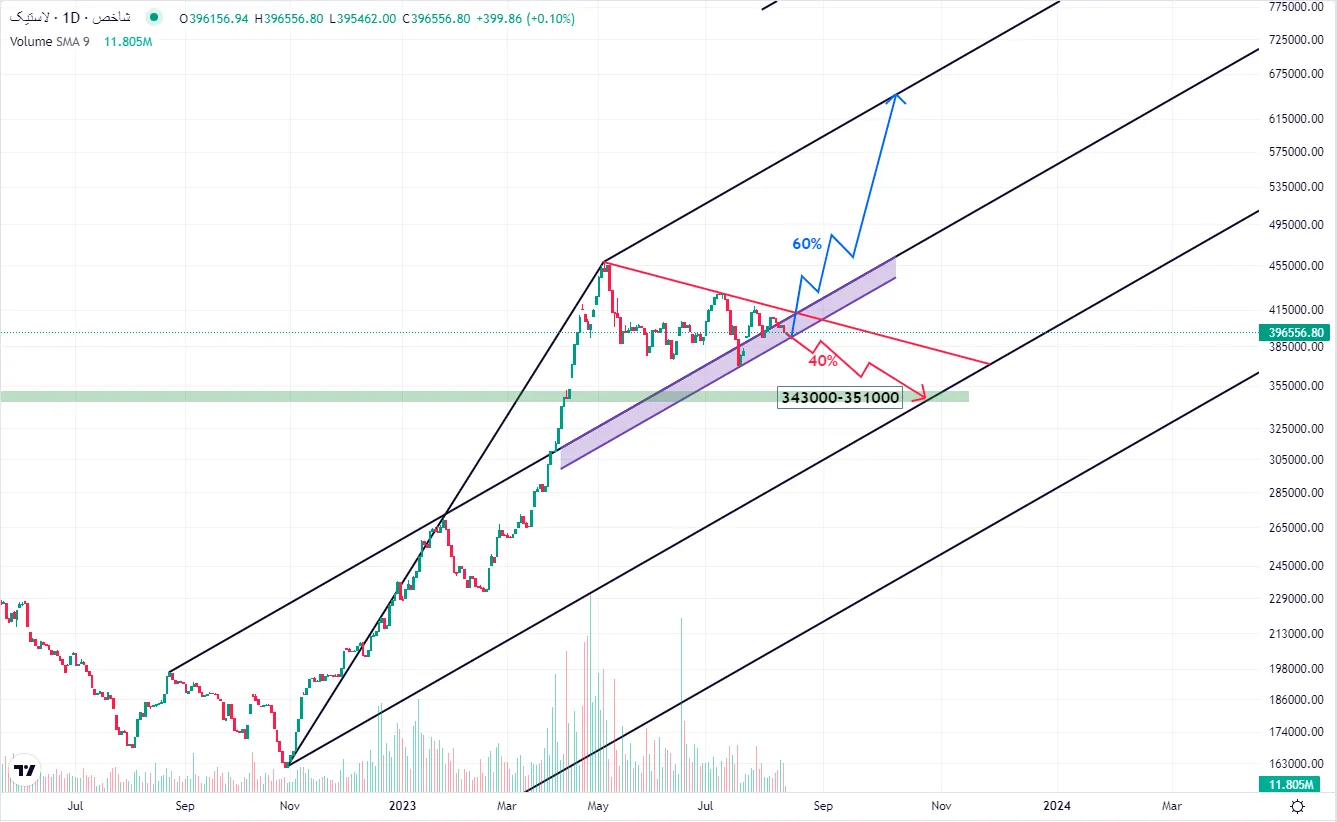
Therefore, two scenarios can be expected according to what is specified in the chart image. The bullish scenario, which is more likely to happen, is the collision of the rubber and plastic industry indicator with the drawn parallel sliding and then breaking the red downward trend line. In this scenario, the index target is the upper parallel touch of the midline.
The bearish scenario will occur if the index loses its sliding. In this case, the shareholders of this industry should wait for the end of the correction in the range of 343 to 351 thousand units. This range has been an important ceiling in the downtrend in the past. Moreover, the previous upward trend has formed a trading node exactly in this range.
Technical analysis of Packerman stocks
From a technical point of view, in the weekly time frame, Packerman’s stock price shows a flag pattern. The pole of this flag is formed by the upward trend of the stock that started in 1997. “Packerman” symbol was also not excluded from the fall of 1999, and with the beginning of the fall of the flag phase, this pattern began to appear slowly in the share price chart.
The second part of this pattern consists of three different phases. A falling spike phase between two triangle-shaped compressions, as seen in the image, forms the second part of the Packerman flag pattern. Finally, the recent upward trend of the capital market, which started in November of last year, spread to this share as well, and the shares of Barez Industrial Group entered a new trend. Crossing the price range from one thousand 702 to one thousand 719 tomans was a confirmation stamp (CHOCH) on the validity of the trend change. Because the above-mentioned range was the last ceiling swing confirmed in the previous downtrend.
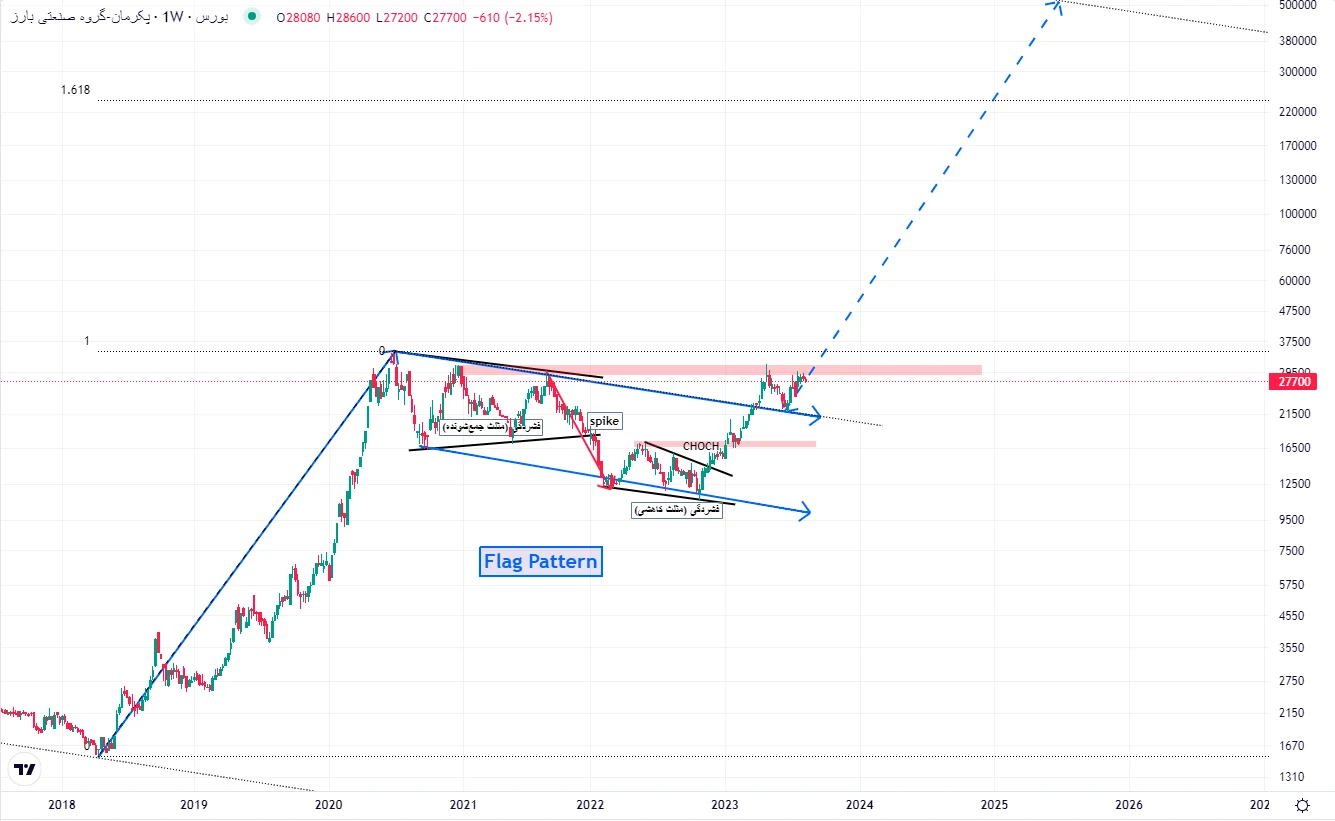
Currently, during its recent upward trend, the price managed to break the upper side of the flag pattern well and pass through it. Also, the correction process of the stock market, which started in the middle of May this year, was completed by Polbak.
In technical harmonic style, when the share leaves its flag pattern, the size of the flag pole is used to determine its price target. This technique activates the potential of achieving the dream goal of 51 thousand Tomans per share of “Packerman” for the shareholders.
What should be considered in this analytical perspective is its time dimension. The previous upward trend of “Packerman” lasted nearly two and a half years, and during this period, it experienced a growth share of 2,086 percent. From the breaking area of the flag pattern to its target, there is a path of 2,100 percent for Packerman stocks. Therefore, expecting to achieve these goals overnight is wrong.
In another view, the comparison between the first wave of the two current and past uptrends gives interesting points to technicalists. As it is clear in the picture, the first wave of the previous upward trend has brought a 158% growth for Packerman shareholders during 24 working weeks. In the first wave of the current upward trend, the share also shows similar numbers. This time, within 26 working weeks, the “Packerman” icon experienced a growth of 183%.
Also, if we connect the starting and ending points of each wave in two upward trends, the angle of both drawn lines is very close to each other; 60 and 61 degrees.

Based on this comparison, we can conclude that the movement acceleration of these two processes can be similar in the future, as it has been very similar so far.
Disclaimer: All contents included in this site are research, scientific and news and are not recommended for direct activity in any market.
Read more market analysis reports on the Capital Markets page.