Technical analysis of Pakvir shares in October 1402 / Will the sharp and sharp rally of Pakvair be repeated?

According to Tejarat News, it was announced last week that a 20% increase in the price of radial tires has been issued and manufacturers can apply this price increase to their products. For the same reason, in a series of reports, Tejarat News examined the performance of tire companies and their status in the stock market. Accordingly, the technical analysis of Pakvir shares has been reviewed today.
Queirtyre company is traded on the first market of the stock exchange with the symbol “Pequier”. The shares of this company with a market value of 4,453 billion Tomans are in the rubber and plastic products group.
The analysis of “Pekvir” trading board shows that the price behavior of this share takes place with a short break in the direction of suspicious legal movements of the share. Therefore, every time the rights started to make heavy purchases, a little later, the share of floor swings made in its chart has given good returns to the shareholders. Therefore, in order to recognize the validity of the upward wave, it is very important to examine the legal behavior of the share.


Technical analysis of rubber and plastic index
The upward trend of the stock market started in November last year. The symbols of the rubber and plastic industry were not excluded from this trend. The upward trend continued until the middle of May and included two smaller corrective trends. However, in the technical analysis of the index chart of this industry, the size of the downward wave before the start of the downward trend is used. The reason for this is the similarity of the size of the chart correction from the middle of May until now to the size of the last downward wave before the beginning of the upward trend.
By drawing a Pullback Fork, you can guess potential reversal points. Drawing a parallel slide next to the centerline of the Pullback fork, however, shows that the tire index has broken this line down.
This significantly dims the bullish outlook for the rubber and plastic industry. Currently, this indicator is placed between two rectangular ranges. The neutral trend of this group’s index will continue until one of these two ranges is broken upwards or downwards. Therefore, it is necessary to carefully monitor the behavior of the price when the index is in the range of one of these boxes.
Technical analysis of Pakvir stock
The second kinetic wave of Pequir’s upward trend began at the beginning of March last year. This bullish wave brought a 141% return to the shareholders of Desert Tire Company in just 34 trading days. Since then, the price trend of Pakvir shares has been locked in a squeeze. This compression, along with the explosive growth of this share, has created a flag pattern in the price chart of Pakvir.
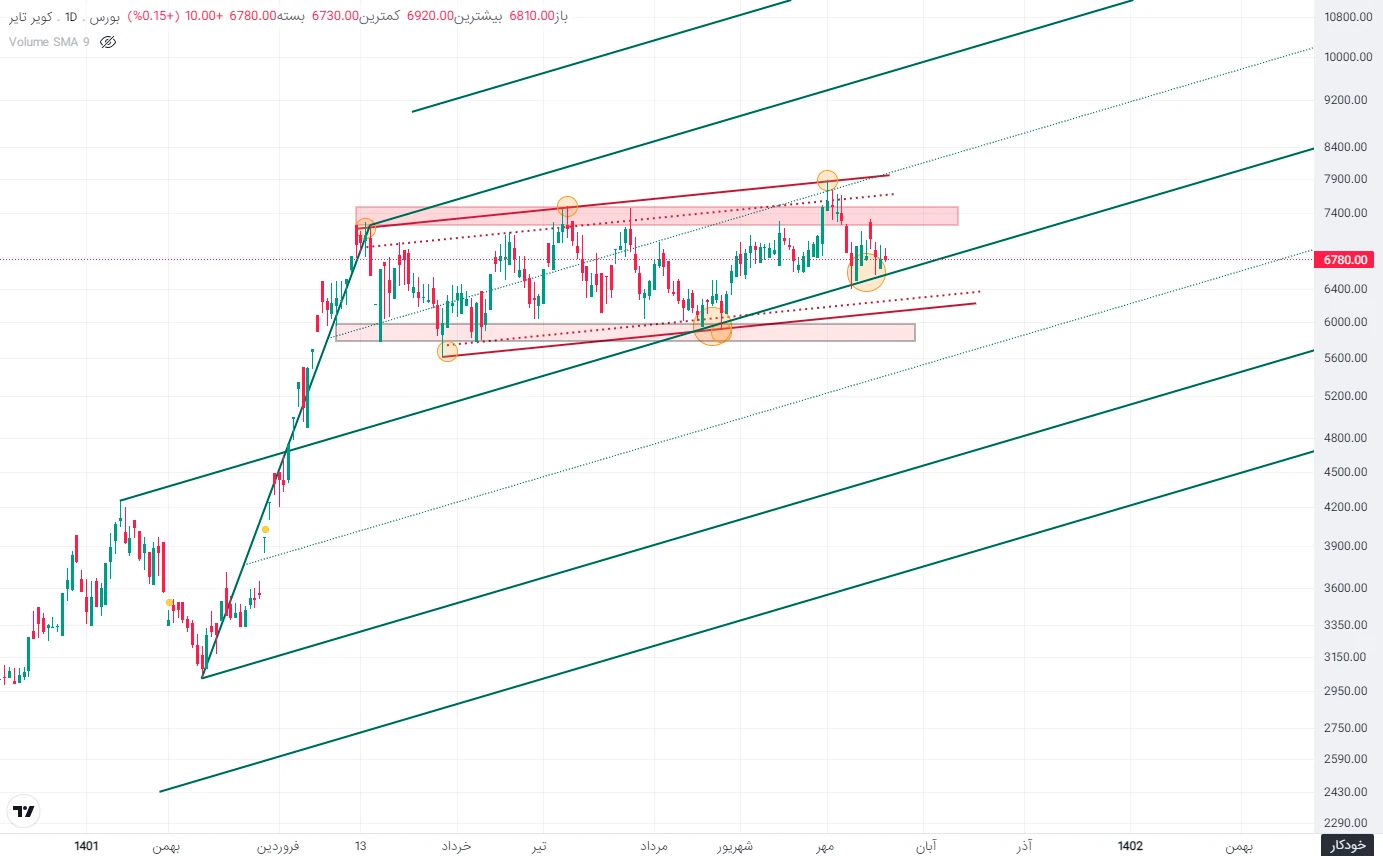
Drawing a PBML-style Andrews fork (which is a bearish fork in an uptrend used as a trend reaction analogy) can give traders a roadmap for price action.
Price collisions with the middle line and price respect to it show that the frequency of this tool is well accepted by the chart. Therefore, it can be claimed that as long as the price is above the midline, the more likely scenario is the compression from above and the beginning of the next leg of the uptrend.
Also, paying attention to the two static ranges that have limited the price will help to optimize the entry of traders and shareholders into Pakvir shares. It also seems that the drawn dynamic channel has identified the price behavior of this symbol with higher accuracy. Breaking the floor of 578 to 597 tomans and stabilizing the price within three daily candles will make the bullish scenario completely disappear from the minds of Kavir Tire shareholders.
In case of failure of compression from above, the minimum target will be the price of 916 Tomans, which is equal to the level of 127% of the previous upward wave. The next target will be the level of 1,239.
Disclaimer: All contents included in this site are research, scientific and news and are not recommended for direct activity in any market.
Read more market analysis reports on the Capital Markets page.