Technical analysis of Plast stock in August 1402 / Plast completed the head and shoulder pattern

According to Tejarat News, Plastiran Manufacturing Company is tradable on the over-the-counter yellow base market with the symbol “Plast”. The term “cancellation accepted” in the trading board of this share shows the risks associated with this share.
“Plast” with a market value of 706 billion is located in the rubber and plastic industry. Also, the P/E ratio of this symbol is in the range of 5.83, which is classified among the low P/Es of the market.
The analysis of the Plast trading board shows that the price behavior of this share takes place with a short break in the direction of suspicious legal movements of the share. Therefore, whenever the right has started to make heavy purchases, a little later, the stock has given good returns to the shareholders from the floor swings made in its chart. Therefore, in order to recognize the validity of the rising wave, it is very important to examine the legal behavior of the share.


Technical analysis of rubber and plastic index
The upward trend of the stock market started in November last year. The symbols of the rubber and plastic industry were not excluded from this trend. The upward trend continued until the middle of May and included two smaller corrective trends. However, in the technical analysis of the index chart of this industry, the size of the downward wave before the start of the downward trend is used. The reason for this is the similarity of the size of the chart correction from mid-May until now to the size of the last downward wave before the beginning of the upward trend.
By drawing a Pullback Fork, you can guess potential reversal points. Drawing a parallel sliding near the midline of the pullback fork introduces an important retracement level to the technicalist.
Therefore, two scenarios can be expected according to what is specified in the chart image. The bullish scenario, which is more likely to happen, is the collision of the rubber and plastic industry indicator with the drawn parallel sliding and then breaking the red downward trend line. In this scenario, the index target is the upper parallel touch of the midline.
The bearish scenario will occur if the index loses its sliding. In this case, the shareholders of this industry should wait for the end of the correction in the range of 343 to 351 thousand units. This range has been an important ceiling in the downtrend in the past. Moreover, the previous upward trend has formed a trading node exactly in this range.
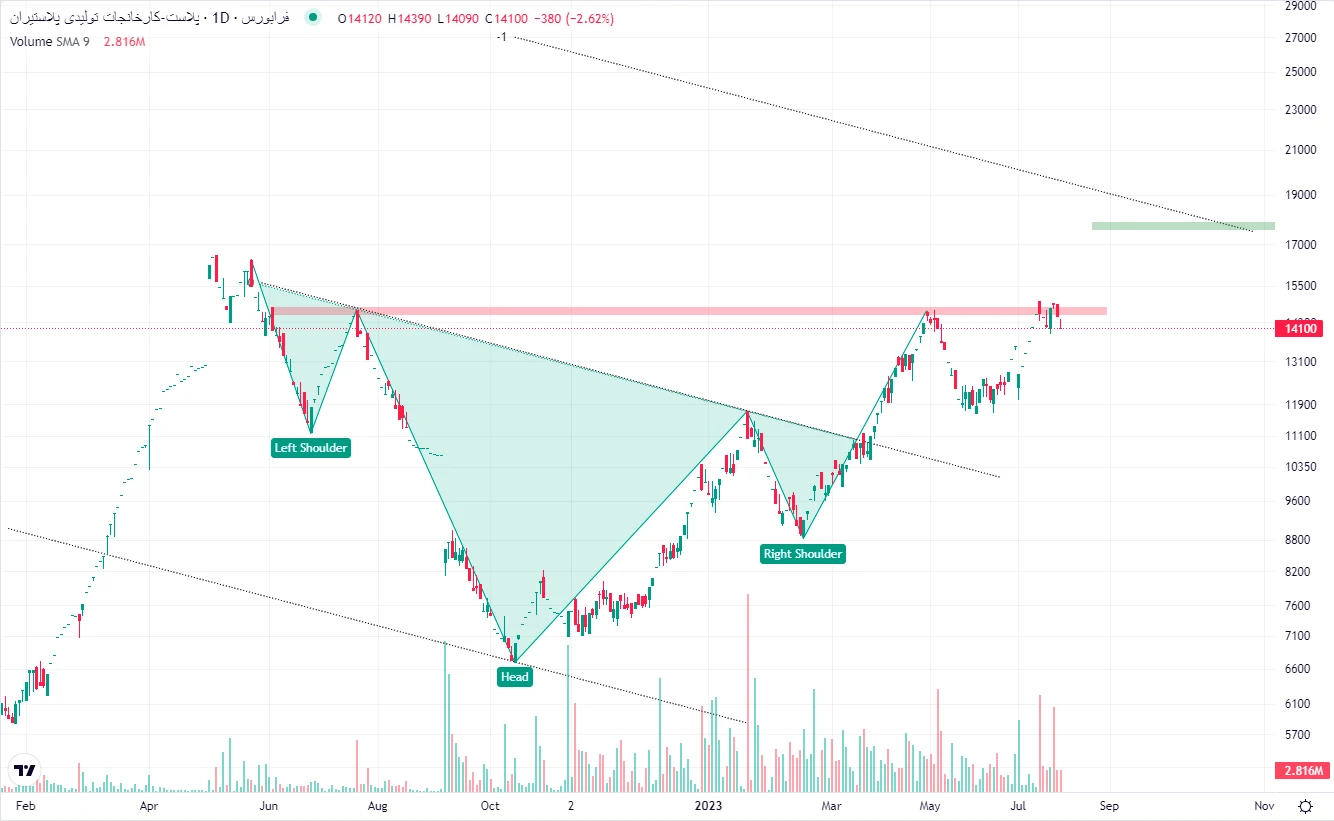
Technical analysis of Plast stocks
What is evident in the technical analysis of Plast stock is the formation of a completed pattern. After breaking the neckline of this pattern, the price has identified the green box as a target. Based on this, it can be expected that if the current important resistance in the range of 1,453 to 1,480 Tomans is broken, a target of 1,782 Tomans will be available for Plast’s share price.
On the other hand, in a closer zoom, the drawing of two Andrews forks, one in the direction of the trend and one against the direction of the trend (pullback fork), identifies an important energy point in the price chart of the Plast symbol. The behavior of the price when it is at the frequency of the black Andrews fork is reminiscent of the fifth principle of Alan Andrews. When the price changes direction before hitting the middle line, according to Hagopian’s law, it will have a lot of power in the new direction it started.
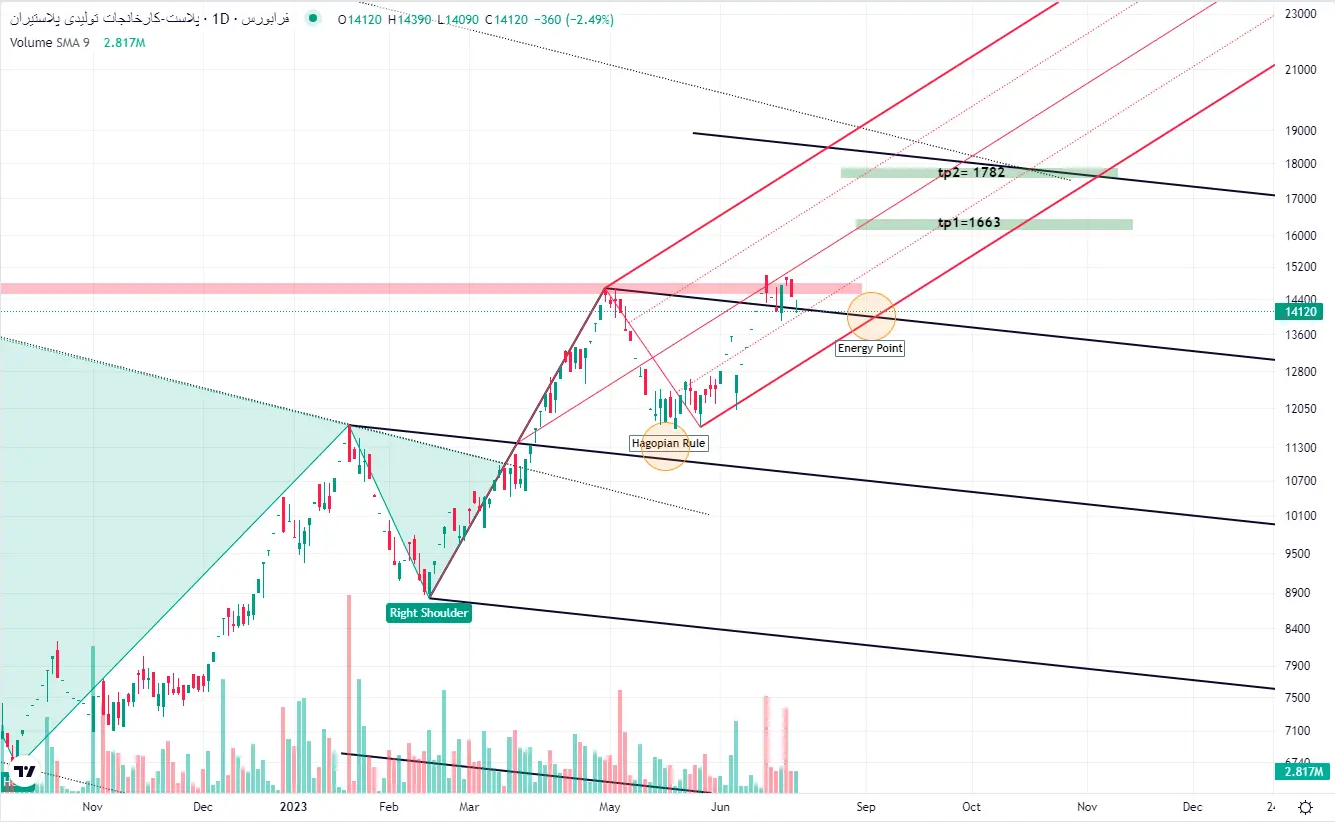
The red fork is also a Modify-Schiff fork, which is drawn in the direction of the upward trend of the share. The behavior of the price in dealing with the fork lines also shows that the frequency of this tool is accepted by the price. Based on this, the price is expected to reach the energy point (in which direction is not clear and does not matter) and then move towards the targets specified in the chart.
Obviously, the upward outlook for this share is valid as long as the swing floor is not broken in the range of 1,700 Tomans.
Disclaimer: All contents included in this site are research, scientific and news and are not recommended for direct activity in any market.
Read more market analysis reports on the Capital Markets page.