Technical analysis of Sashahed / share correction period ends? – Tejarat News

According to Tejarat News, Shahid Company was included in the list of companies admitted to the stock exchange in 1984 and placed in the real estate group. Despite this classification, the control group has extensive activities in other fields such as commerce, fuel and energy, as well as the capital market.
Technical analysis of Sashahed
In the long-term analysis of the price-time chart of Sashahed, the downward trend of this stock, which lasted more than two years, was formed in the form of five waves.
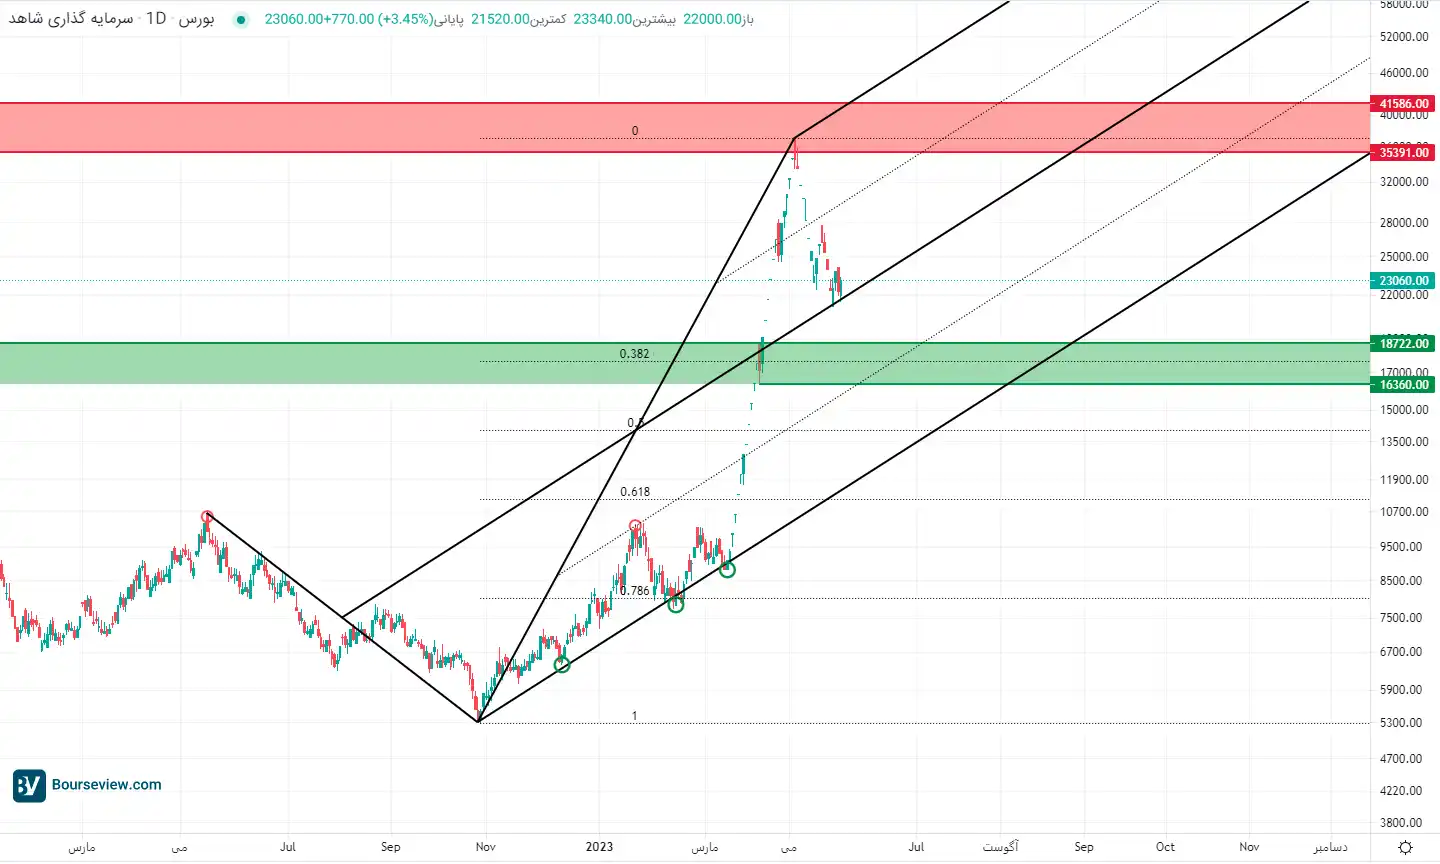
A look at the behavior of the price in the weekly time frame shows that “Thashehed” has set its turning point by recording the famous reverse head and shoulder pattern at the price floor of 529 Tomans. Sashahed stock price has entered the correction process by approaching the second level of the generalized depth of Sorushane pattern and also the resistance range of 3 thousand 539 to 4 thousand 586 tomans. It should be mentioned that in the downward trend of 1999, trading nodes were created in this area.
Prohibited behavior in Sashahed
An important point that should be noted in the technical analysis of Sashahed is that the price of this share does not reach the technical limits in most cases and generally changes its behavior a little before that. For example, the range of 485 Tomans was considered an important trading node for Sashahed, as technicians were waiting for a change in price behavior in this range. Sashahid’s share recorded its return at the price of 529 tomans, while it was only eight percent away from it.
Another example of this point is the recent ceiling analysis. The ceiling of three thousand and 704 Tomans was registered while it was only five percent away from the ceiling of the drawn channel. Therefore, in order to predict the continuation of Sashahed’s path, one should not wait for the price to meet the important ranges.
Read
The investment growth rate was 7.7%/ decrease in the government’s share of capital market capacity
Daily chart of three indicators under the technical microscope
The drawing of Schiff’s modified Andrews fork on the last moving leg of the former downtrend may show us the road map of Sashahed. The many encounters that the price has had with the lower parallel of the middle line increase the validity of this drawn tool.

Now there are several scenarios for Sashahed’s share. Waiting for a return from the midline of the Andrews fork, which we saw today again after its collision and retest, increased demand in the stock. The second scenario is the continuation of the correction until touching the green box range, which was considered an important ceiling in the previous downward trend of the share and is now a valid support for Sashahid.
In the pessimistic scenario, there is a possibility of correcting the share to the lower parallel of the fork, which seems to be unlikely due to the existing economic factors, including high structural inflation.
As a conclusion, the behavior of the price should be carefully analyzed when the price reaches the limits of potential for return, and in case of signs of money entering the share, the optimal entry should be made by observing the appropriate loss limit.
It should be noted that this technical analysis is only theoretical and theoretical, and people should buy and sell based on their analysis. Tejarat News Group is not responsible for the buying and selling of shares by individuals in the capital market.
Read more reports on the stock news page.


