Technical analysis of Shabandar, May 1, 1402 / Correctional phase waiting for the refining giant?
According to Tejarat News, Bandar Abbas Oil Refining Company was established in 1375 by changing the name of Iran’s National Liquefied Gas Company. The name of Bandar Abbas Oil Refining Company was included in the list of companies admitted to the Tehran Stock Exchange at the end of 1990, and four months later, the shares of this company were listed with the symbol “ShabandarAnd the price of 114 Tomans was offered for the first time.
It should be mentioned that the capital of this company at the time of initial offering was 1,380 billion tomans, which reached 13,434 billion tomans after several stages of capital increase.
The main activity of this company includes refining and processing crude oil and other hydrocarbons, making petroleum products such as gasoline, kerosene, gas oil, heating oil, liquid gas, aircraft fuel and other derivatives and by-products.


Refah Karkaran Bank by acquiring more than 30% of the shares Shabandar It is the largest major shareholder of Bandar Abbas Oil Refining Company.
Parsian Oil and Gas Development Group and Saderat Bank of Iran are other major shareholders of this company. So that each of them has taken 15.42 and 4.8 percent of Shabandar’s shares under their ownership, respectively. It should be noted that 27% of the company’s shares are also in the hands of small or so-called floating shareholders.
Technical status of petroleum products
The group of oil products, which has the symbol “Shabandar” in this industry, crossed its historical ceiling in August 2019, just like the total index.
From a technical point of view, the index chart of petroleum products is in a sensitive position after reaching and crossing the ceiling of the Andrews fork. If the trading flow of the next week causes this index to return to the fork, we can expect a correction to at least two million and 630 thousand units (the ceiling of 1999).
In another scenario, the pullback of the oil products index reaches the broken ceiling of the channel and continues the upward trend to achieve higher goals.
Technical analysis of Shabandar
The opportunity to enter with this setup is related to the last days of last year, where “Shabandar” after exiting its static phase, where the side trend was rectangular, hit the rectangular roof and once again gave its shareholders a good opportunity to enter. has done.
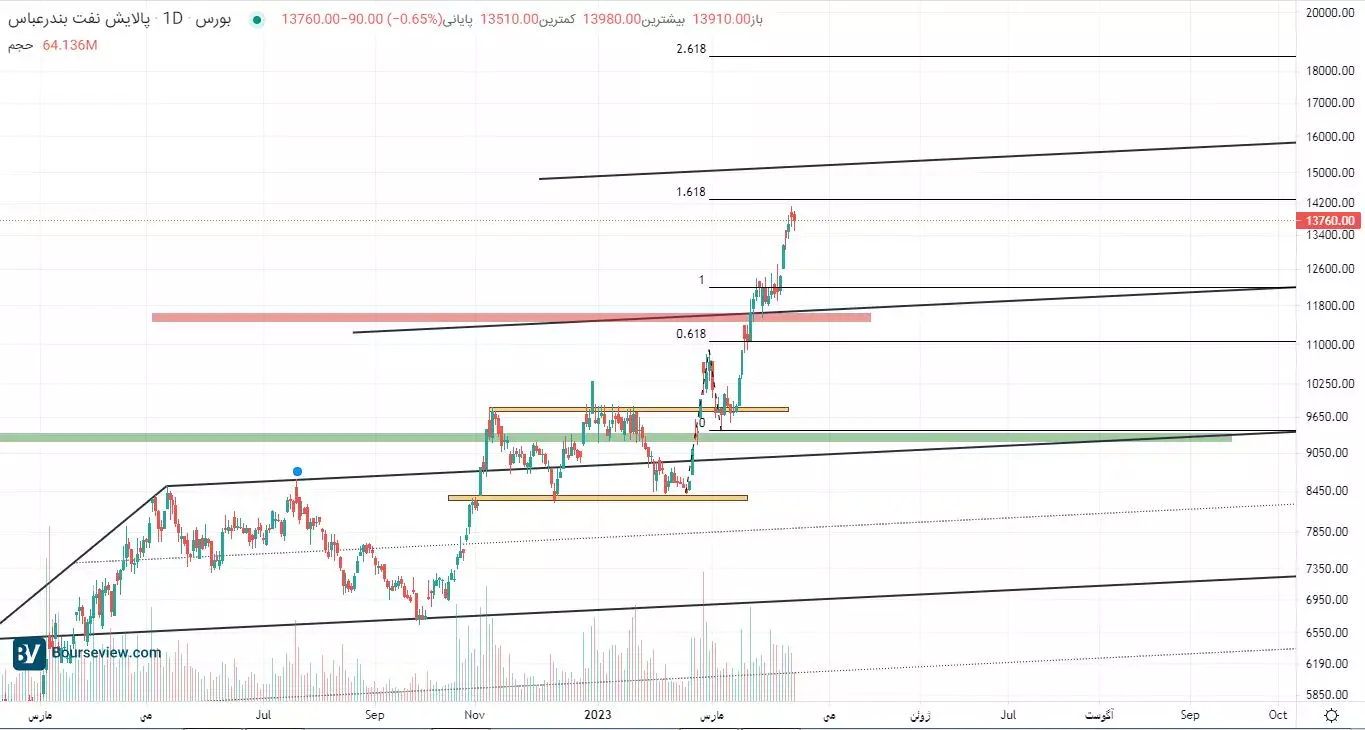
After breaking the first warning line of the Modify-Schiff fork and also the 100% Fibonacci extension level drawn on the previous ascending and corrective step (major), the Shabandar symbol rejected an important resistance around the price of 1,150 tomans in front of it and after the pullback It continued its upward trend.
Currently, however, Shabandar shares are approaching the level of 1.618 Fibonacci extension. According to the status of the oil products index chart, the possibility of correction is higher than crossing the resistance, so the support ranges of the share should be known.
The first support range of the share is the node in the range of 1180 to 1250 Tomans. The compression of the price in this range shows its importance from the supply and demand side. Also, the repetition of the size of the previous correction in the upward trend shows the correction to the same range.
After that, if this range is lost, we can expect the price of this symbol to decrease to the previous ceiling range.
Read more market analysis reports on the stock market news page.