Technical analysis of Shepdis shares in Shahrivar 1402 / Pardis Petrochemical flight has started? – Tejarat News
According to Tejarat News, Pardis Petrochemical Company can be traded on the first market of the stock exchange under the symbol “Shepadis”. “Shepedis” is located in the petrochemical industry with a market value of 98 thousand 88 billion tomans.
The analysis of Shepdis trading board shows that the price behavior of this share takes place with a short break in the direction of suspicious legal movements of the share. Therefore, whenever the rights start to make heavy purchases, shortly after the floor swings made in its chart, the stock has given good returns to the shareholders. Therefore, in order to recognize the validity of the upward wave, it is very important to examine the legal behavior of the share.
Technical analysis of Shepdis shares
Technicians will notice the upward trend of this stock in the weekly time frame by simply identifying the structure of Shepdis stock price chart. There are three correction waves in the picture.


Using the Andrews Fork tool shows, these three corrective waves are of similar size and belong to the same family. This information provides an important road map to shareholders. Currently, by drawing an Andrews fork in the midline pullback style and projecting the latest correction size, we notice the repetition of the previous correction size.
Price collisions with the drawn middle line indicate that the price accepts the frequency of this instrument. The orange circle shows BOF (Break out failure) on the middle line.
In this case, the price penetrated to the levels lower than the middle line, activated the stop loss orders of the shareholders who were hidden behind the previous floor (range of 13 thousand and 930 Tomans) as the last support bastion and then started to move.
Has the upward trend started?
Based on the classic technical, Shepdis stock price has already made a higher floor and ceiling and an upward trend pattern has formed. Breaking the level of 16 thousand and 732 tomans, caused the formation of CIB in the Shepdis stock price chart and is a confirmation of the validity of the upward trend.
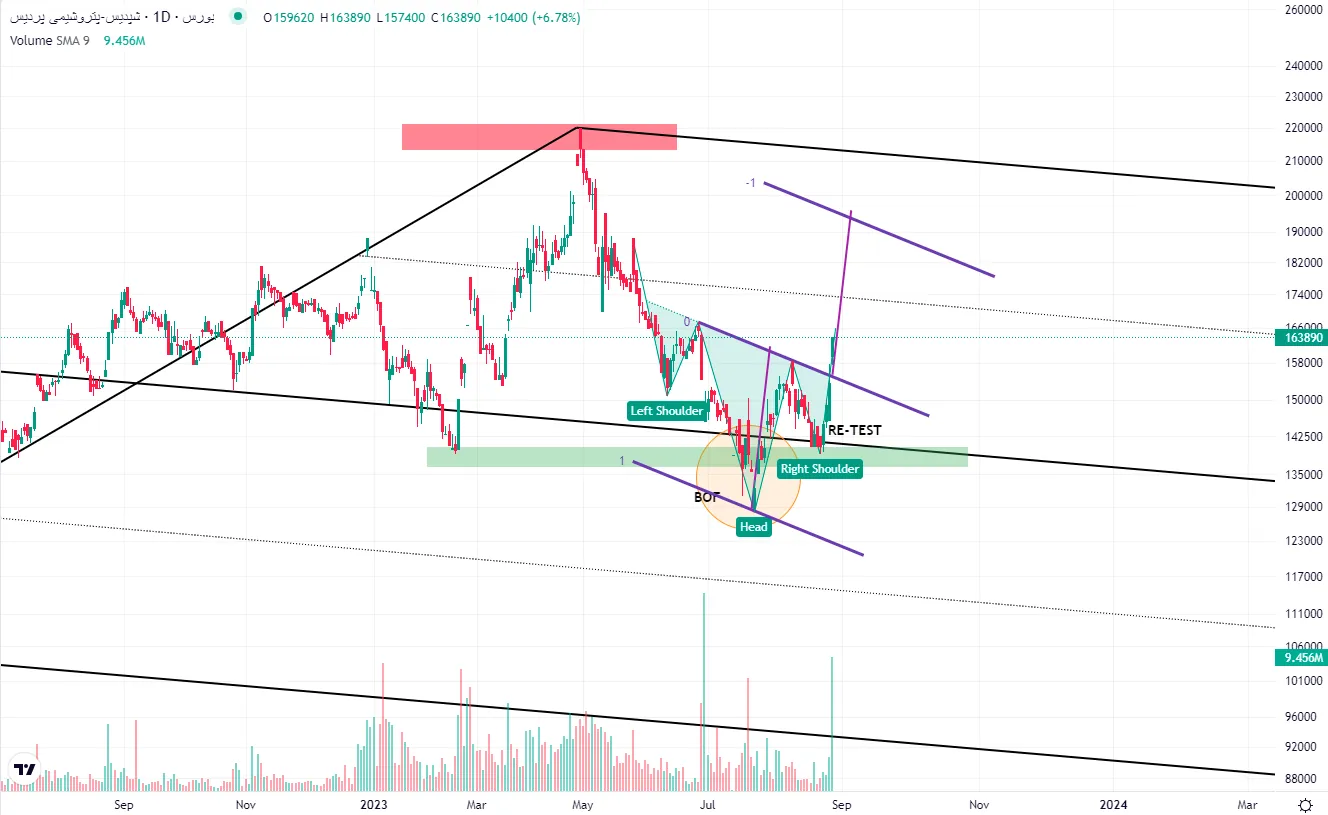
Another point that can be pointed out in the Shepdis chart is the formation of an inverted peak pattern. The growth of Shepdis has broken the neck line of the upside down pattern with the help of demand during the last two days. This issue activates the target range of 18,830 to 19,000 tomans for Shipdis.
After that, the last ceiling of the previous upward trend in the range of 22 thousand tomans and the level of 127.2 and 161.8 percent Fibonacci correction drawn on the previous upward wave shows the larger targets of the “Shepedis” symbol; The level of 26 thousand 807 tomans and also the level of 34 thousand 431 tomans are the medium and long term targets of this share.
Disclaimer: All contents included in this site are research, scientific and news and are not recommended for direct activity in any market.
Read more market analysis reports on the Capital Markets page.