Technical analysis of “Thakht” stocks, November 1402 / “Thakht” rising marathon has started? – Tejarat News

According to Tejarat News, the international building development company with the symbol “Sakht” is tradable on the first OTC market. The shares of this company with a market value of 3,369 billion Tomans are in the mass production group.
The analysis of the trading board of “Sakht” shows that the behavior of the price of this share takes place with a short pause in the direction of suspicious movements of the shares’ rights. Therefore, every time the rights started to make heavy purchases, a little later, the share of floor swings made in its chart has given good returns to the shareholders. Therefore, in order to recognize the validity of the upward wave, it is very important to examine the legal behavior of the share.
Technical analysis of accumulation index
The upward trend of the stock market started in November last year. The symbols of the mass production industry were not excluded from this trend. The upward rally of the market continued until the middle of May. Currently, after 23 weeks of correction, the index of the accumulation group has shown some openings of hope to change the trend in its chart.


The technical analysis of the chart of the accumulation group index, in the weekly dimension, shows that the dominant trend of the share is still upward. Although the index’s previous rally was unable to cross its historical ceiling in the range of 21,268 units, it crossed all the ceiling swings confirmed by the fall of 1999.
This indicator was able to cross the resistance range of 14 thousand 649 to 14 thousand 828 units in the candle on the first day of November, which is indicated by the red box in the image below. This range is the last approved ceiling of the correction process. In fact, passing through it, the index issues a very important sign of changing its behavior.
The crossing of the group of mass builders through this range required stabilization, which has not been achieved until now. Even the return of the index below this range, which happened in today’s candle, provides the risk of reducing the height of the index at least to the range of 13,905 units.
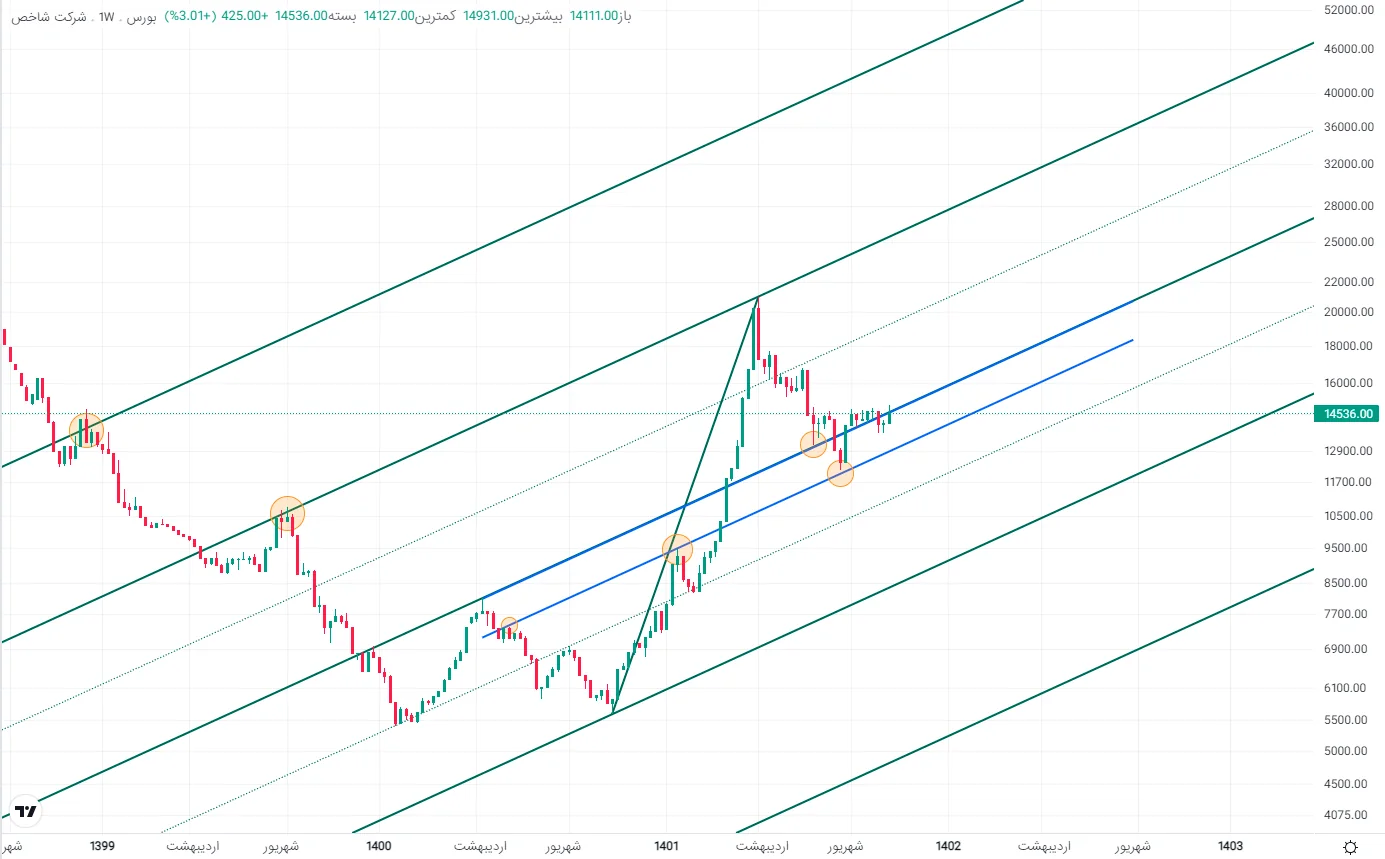
The chart of Mass Makers in the weekly timeframe shows that this indicator has well accepted the frequency of the Andrews fork. The way the indicator behaves with the Andrews fork lines conveys this importance. The return and stabilization of this index above the middle line is necessary in order to reach the upper parallel of the fork. Currently, as checked in the daily timeframe, the price crossing the mentioned range fulfills both the conditions of the bullish scenario, i.e. the sign of a change in behavior and placement above the drawn middle line.
Technical analysis of stocks
The correction flow of the stock market, which started in the middle of May, also spread to the stock trading flow of the International Building Development Company. It is still not possible to say that the 167-day correction of “Thaqt” is over because the sign of price behavior change (which for technicalists is the crossing of the last approved ceiling of the correction process) has not appeared on the chart; However, the behavior of the price indicates signs for the tendency to finish the corrective process; A deep correction that led to a 44% decrease in the price of this symbol from the ceiling of May 17.
But why has the possibility of a bullish scenario increased? The most important reason is the failure of an important corrective trend line that cast a heavy shadow on the trading flow of the “Thakht” symbol during the past 6 months. Currently, the last confirmed ceiling of the correction process was made in the range of 392 to 394 Tomans. This range is the first resistance in front of the share.

If this range is broken, the new trend rate of the share will be measured. Also, another advantage that exists in crossing and stabilizing the price above the range of 392 to 394 is the disappearance of the suffering trend scenario. In this case, the share fluctuates between a resistance range and a support range, which is the level of 332 Tomans.
The suspicious increase in trading volume at the same time as the downtrend line breaks, adds to the credibility of this break and increases the probability of a bullish scenario for this stock more than other situations. However, in a situation where important systematic risks have cast a shadow on the market, the chance of any event should be taken seriously. Therefore, we should not ignore the fact that the limit of validity of this analysis is that the stock price of the building development company remains above the floor of 320 tomans.
Disclaimer: All contents included in this site are research, scientific and news and are not recommended for direct activity in any market.
Read more market analysis reports on the Capital Markets page.