Technical analysis of the website / Are new targets touched? – Tejarat News

According to Tejarat News, the shares of Bank Mellat, which was established in July 1359 from the merger of 11 other banks, were listed on the Tehran Stock Exchange in February 2007.
The capital of this bank at the time of initial offering was 1,310 billion tomans, which reached 26,204 billion tomans after several stages of capital increase.
The last capital increase of Bank Mellat was in July 1401, as a result of which the capital of this bank increased by about 26 billion tomans.


Bank Mellat’s shares with a market value of 91 thousand 86 billion tomans are among the most important leaders of the banking group.
Technical analysis of web nation
Following the sharp fall of the stock market in 1999, which lasted from August 20 to November 20 of the same year and the index decreased by more than 42%, Bank Mellat shares also faced a strong downward trend and reached the level of 324 Tomans with a decrease of 35%. (flash 1)
After this level well supported the continuation of the share’s fall, Webmelet was able to reach the level of 440 Tomans with a corrective ascending log consisting of 14 candles (35%). (flash 2)
The negative point of this growth was the formation of a new ceiling lower than the previous ceiling. For this reason, the previous upward trend of Webmelet ended and the new phase of this share’s movement began.
After that, the share price dropped from this level to 260 Tomans and formed a strong support level. (flash 3)
In continuation, the share formed a neutral trend in the box (263-377) from the beginning of February 1999 to the beginning of December 1400.
Where will Webmelet go next?
Fibonacci Extension (EXT) is one of the Fibonacci tools used to determine new resistance levels above 100%. So that if a share crosses its previous ceiling, this tool is used to identify new targets for the share. (This action is also done to identify new bottoms in the downward trend.)
Webmelet’s price chart shows that the share was able to form a relatively good upward trend since the end of December 1400 with the formation of higher floors and ceilings.
By drawing a Fibonacci extension from the beginning of the upward trend, resistance levels of 374 Tomans (100% balance) of Fib EXT and 445 Tomans (1.61 balance) of this tool are obtained.
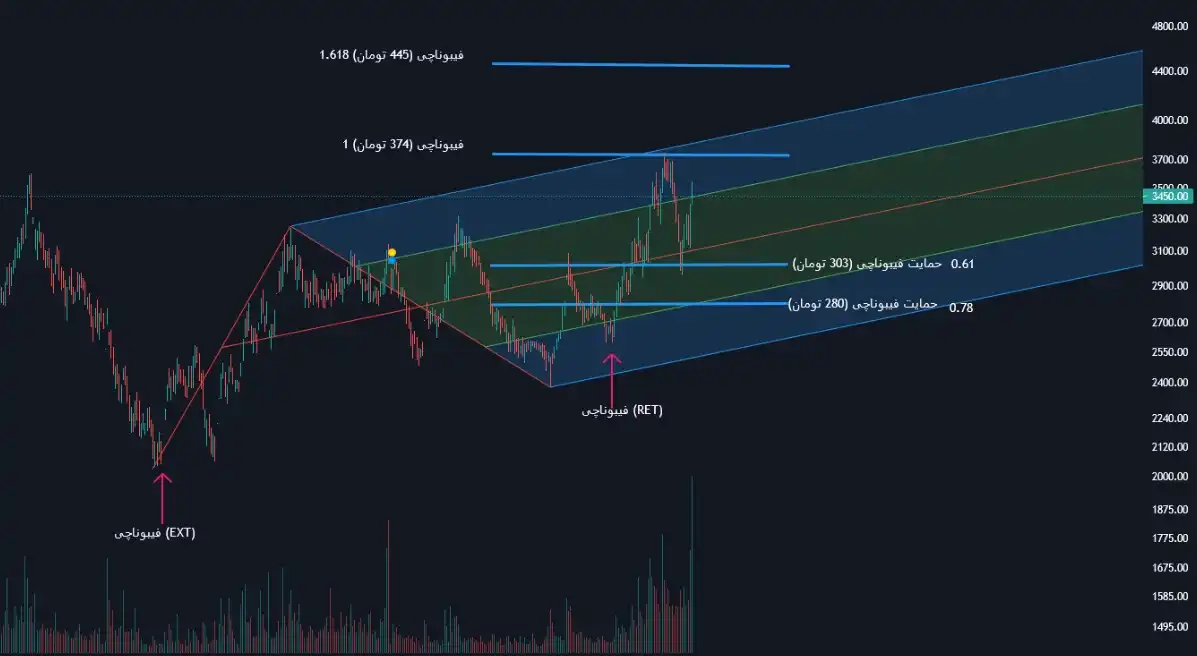
As it is clear in the chart, the level of 374 Tomans obtained from this tool was identified as a strong barrier for the continued rise of this share.
In case of failure of this powerful resistance, another important resistance is the level of 1.61 Fibonacci extension at the price of 445 Tomans.
By drawing the Fibonacci retracement from the new floor of the upward trend on December 19, 1401, support of 303 Tomans is obtained at the level of 0.61 Fibonacci RET, which has played its supporting role well.
If this level is lost, the next support for this share is the level of 280 Tomans, which has been an important support and resistance role for Webmelet in the past.
The drawing of an Andrews fork also shows that Bank Mellat stock in its recent upward trend was able to go up to the top of the fork and then hit the middle line of the pullback fork.
Growth up to this range means that buyers have managed to increase the price just as much as the ascending log that the Web nation symbol formed from December 23, 1400 to April 15, 1401.
In case of increased demand from buyers, the MLH web nation is targeting further forks.
It should be noted that the condition for the stock to reach the fork ceiling again is to cross the resistance of 374 Tomans along with an increase in the value of transactions.
Read more reports on the stock news page.