Technical analysis of “Vamadan” 3 June 1402 / Preparing the share for flight – Tejaratnews

According to Tejarat News, Mining and Metals Development Investment Company is one of the largest investment companies in Iran, which has had a serious presence in the development of the country’s mining sector. “Wamadan” with a market value of 124 thousand billion tomans is currently in the price range of 646 tomans.
Investments in the mining of metal minerals and basic metals are equivalent to 90% of the company’s assets.
Also, 80% of the assets of the Mines and Metals Development Investment Company are composed of the shares of companies admitted to the Tehran Stock Exchange, and most of the company’s investments are concentrated in the iron ore and steel chain.


This company is one of the major shareholders of Iran’s major mining and steel companies, such as Golgohar Mining and Industrial Company, Chadormelo Mining and Industrial Company, Gohrzmin Iron and Steel Company, Sabanur National Copper, Mining and Industrial Company, Khorasan Steel Complex, Arfa Iron and Steel Company, Poya Energy, Karkhanjat Shahid Qandi’s cable construction is a manifestation of the development of mines and metals, the expansion of the Iranian catalyst, the shining light of mines and metals and Tabas Coke Company.
Technical analysis of “Wamadan”
The range of 590 to 600 Tomans was considered the historical ceiling of “Vamadan” until recently. During the upward trend of the capital market that started in November last year, the investment company for the development of mines and metals managed to break this range.
The mentioned range is very important for the share because it has repeatedly prevented the share price from penetrating to higher ranges during the last two and a half years.
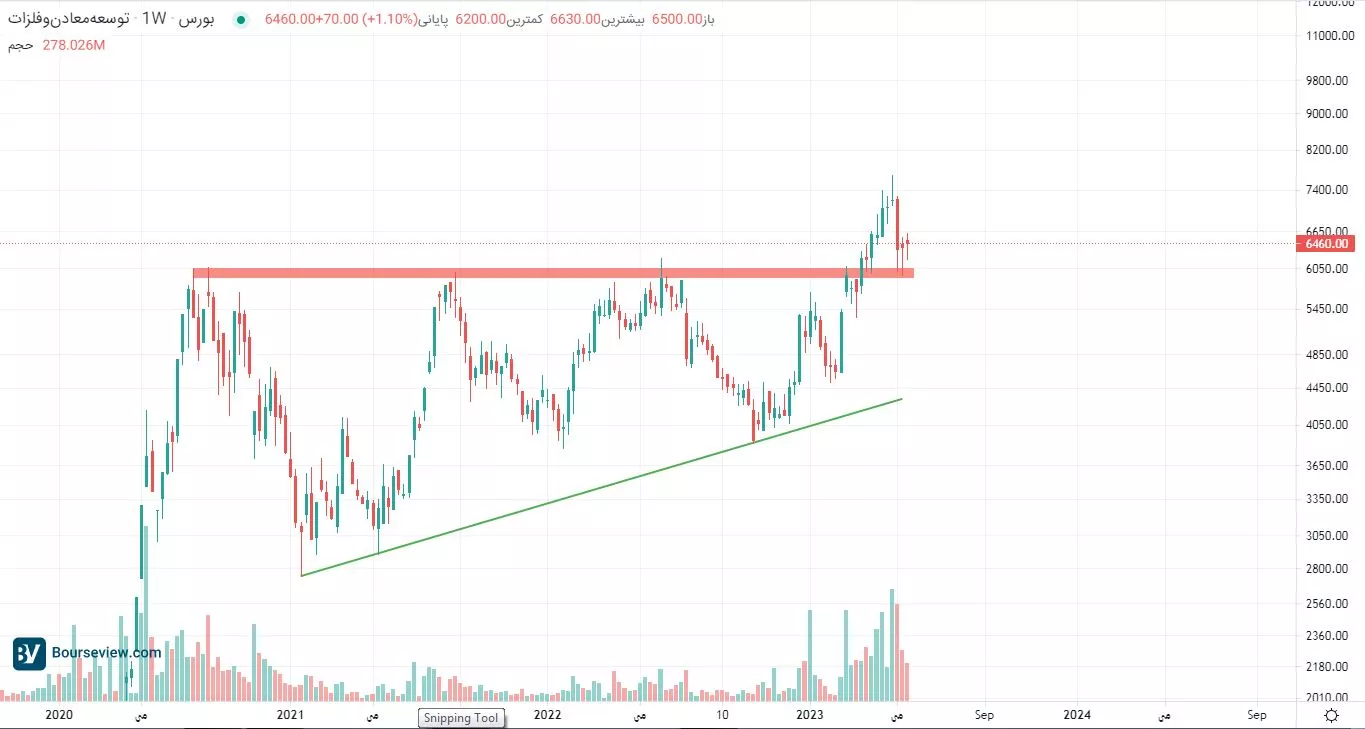
On the other hand, the presence of a price barrier of 590-600 tomans as static resistance and the upward trend line drawn in the “Wamadan” chart indicates price compression in the form of a collapsing triangle. As mentioned, the power of demand has managed to overcome this compression.
Examining the crude behavior of the price in the weekly timeframe shows that “Vamadan” presents a positive outlook to its shareholders from a technical point of view. Obviously, access to price targets is possible as long as the company’s stock price remains above its important static range (590 to 600 Tomans).
Also, the analysis of the share price in the beginning of the recent upward trend until today in the daily time frame, indicates the repetition of the size of the correction in December and February of last year. In this scenario, if the signs of the end of the correction are seen in the “Wamadan” trading board, it can be expected that the price of “Wamadan” will move from the current price ranges in which it is located towards its goals.
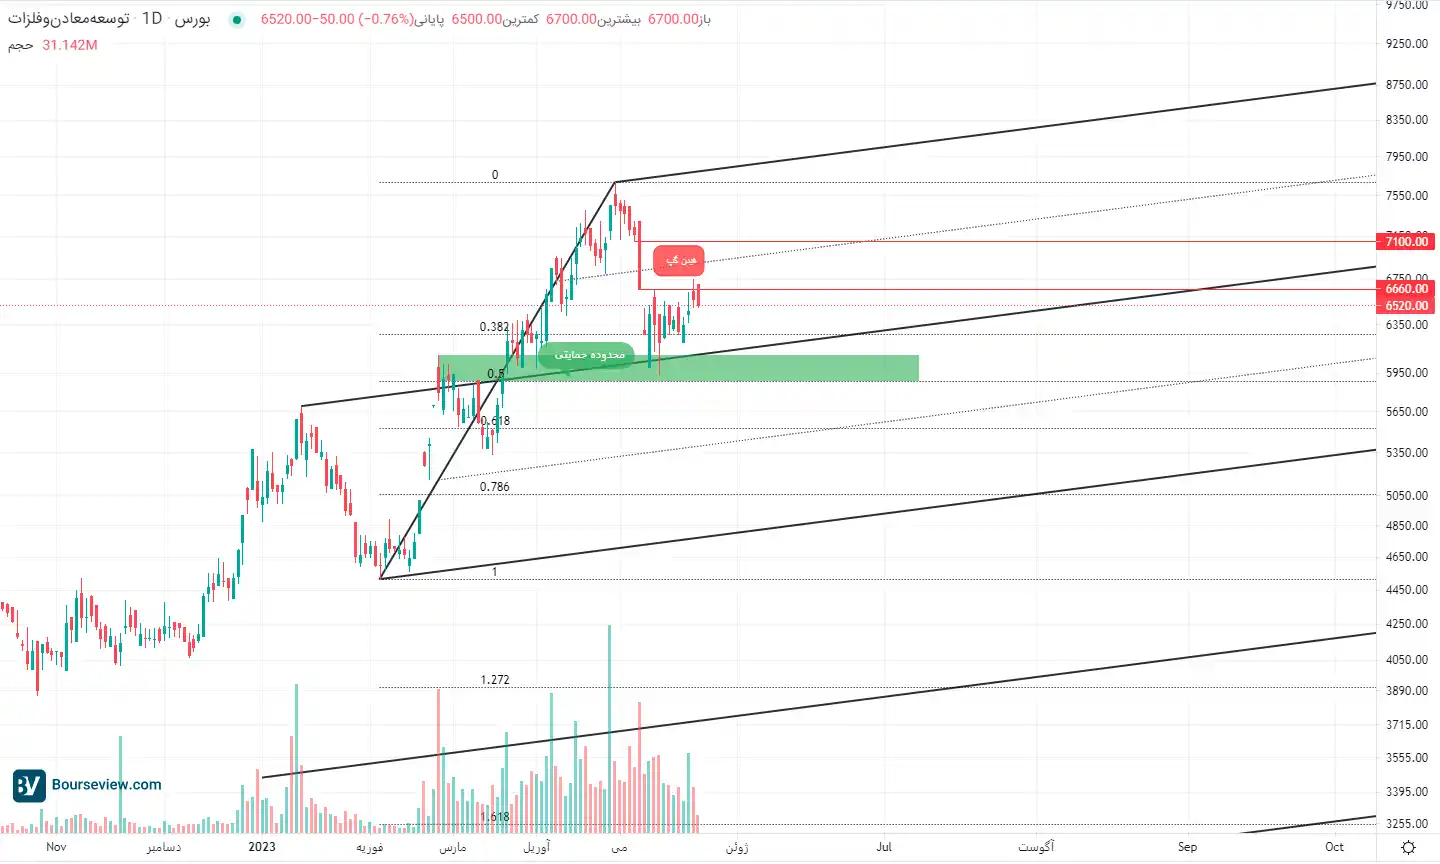
According to the setup drawn in the technical and mining chart, the short-term target of the share is touching the ceiling of the Andrews fork and after that, the level of 1.618 Fibonacci retracement drawn on the previous kinetic wave is the upward trend of the share, which shows the range of one thousand and 68 tomans.
Read more market analysis reports on the stock market news page.